We’re proud to announce the release of version 6.6.0 of our performance testing tool for Video Streaming.
We’ll see in this blog what new features this release brings.
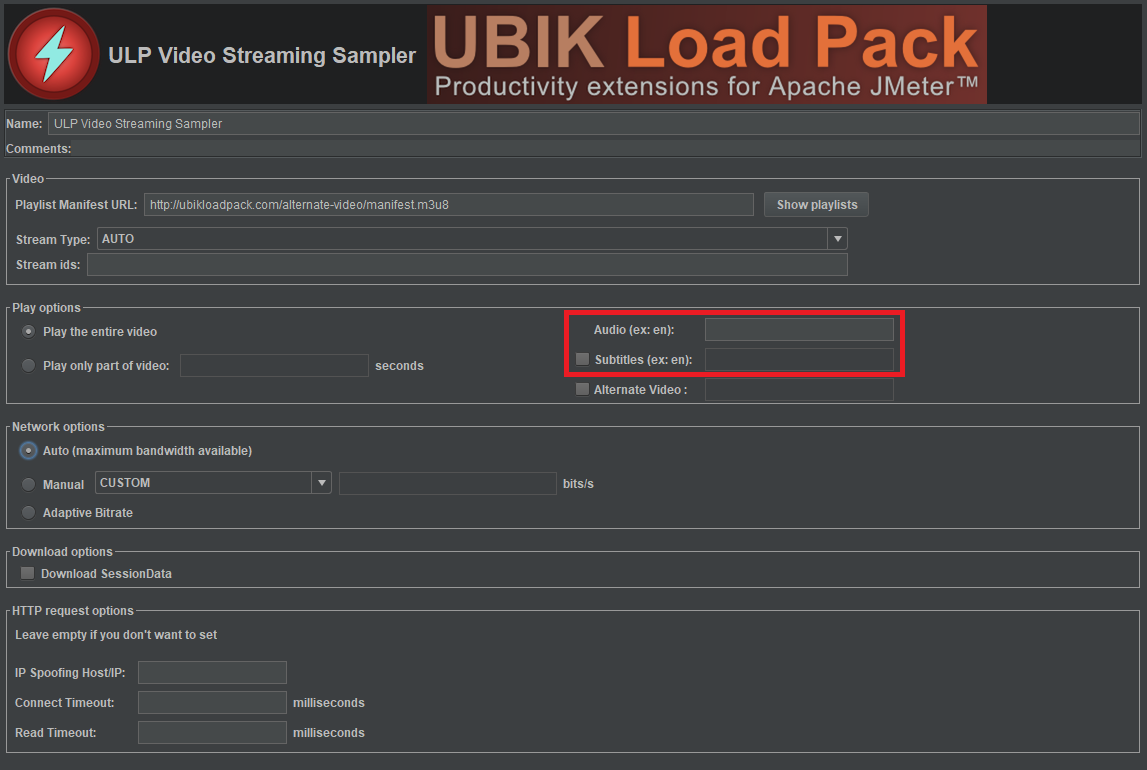
Select the audio track you want to test
It is now possible to select the audio track to test alongside the video. To do that you only have to enter the language of the track. If the field is not set or if the language selected does not exit in the manifest, the plugin will read the default track set in the manifest.
It has the same behaviour for the subtitles tracks.
This features is implemented for all protocols (Dash, HLS and Smooth)
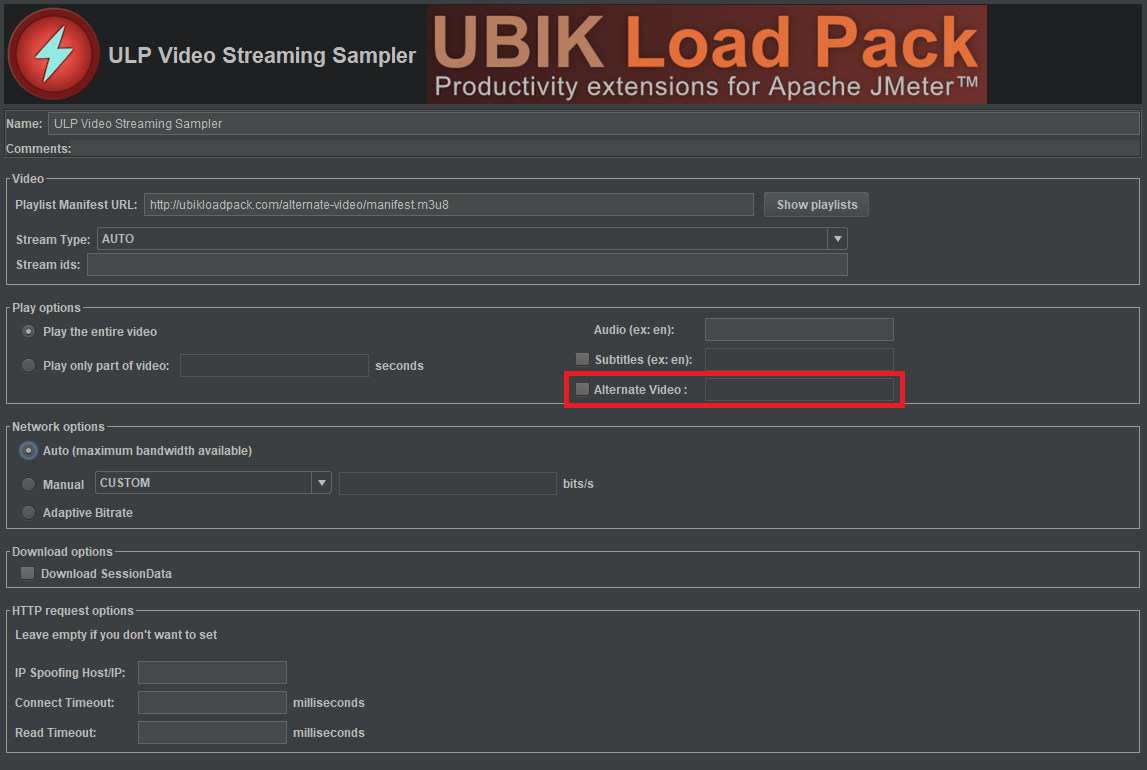
Select alternative video for Apple HLS
This feature is only available for HLS streams
The plugin now supports the VIDEO type attribute for the EXT-X-MEDIA tag. It means that it is possible to test alternate video for the stream (for example another camera angle)
To test an alternate video just select the checkbox and enter the name of the alternate video declared in the manifest.
If the checkbox is selected but the name of the video is not set, the plugin will test the main video.
Other improvements
We changed default settings to improve HTTPS performances
We’re proud to announce the release of version 7.0.0 of our performance testing tool for Video Streaming (HLS, MPEG-DASH, HSS, HDS).
We’ll see in this blog what new features this release brings.
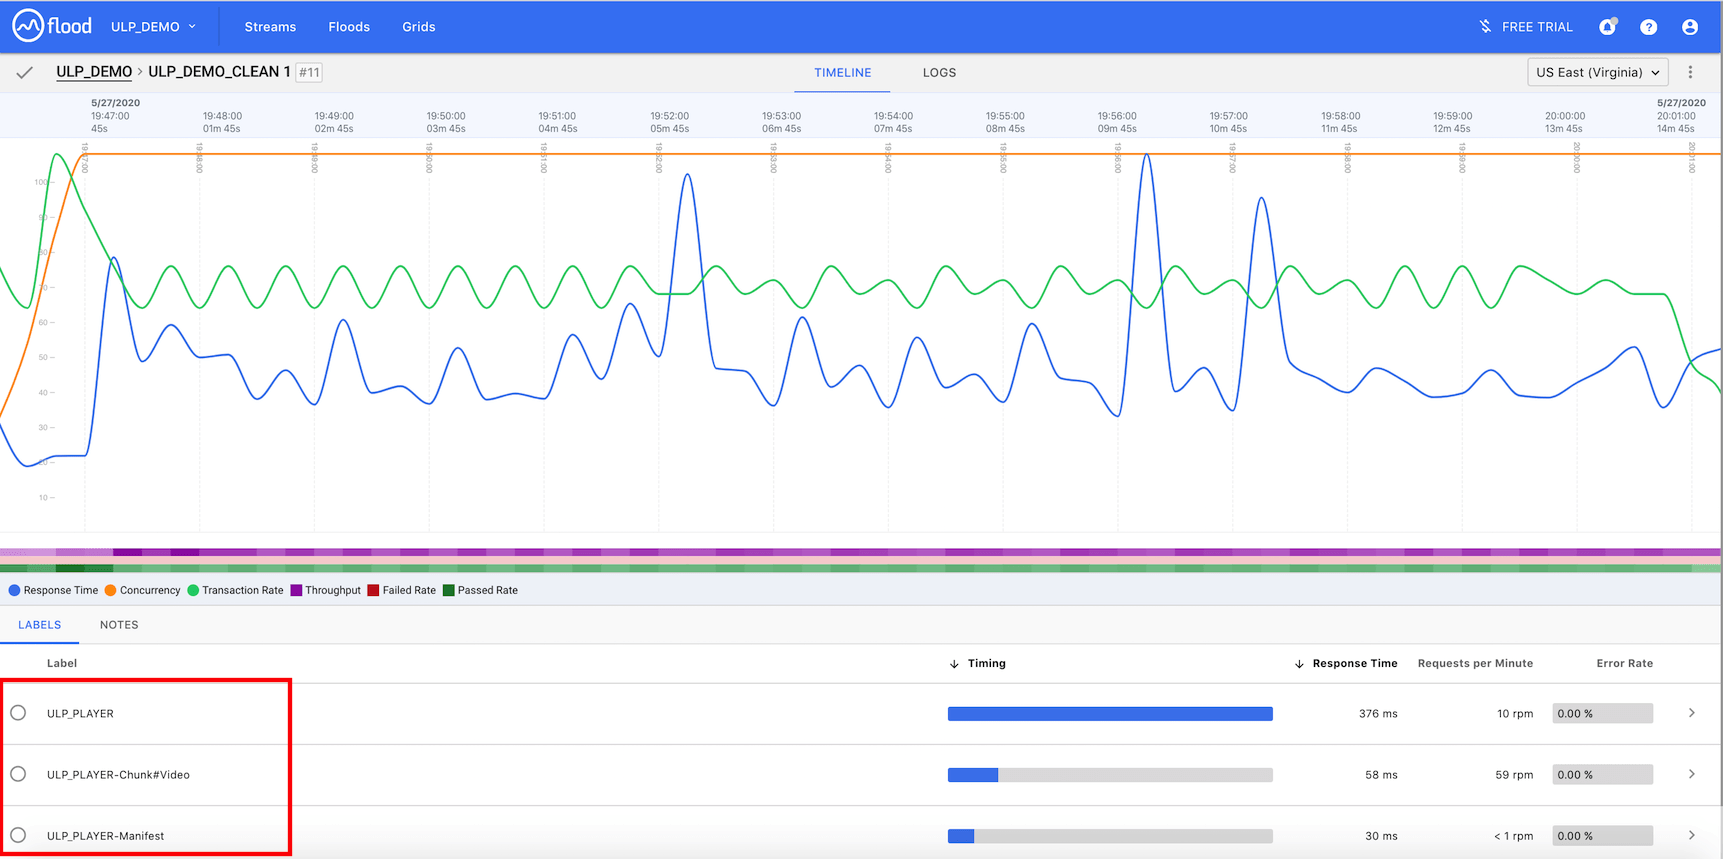
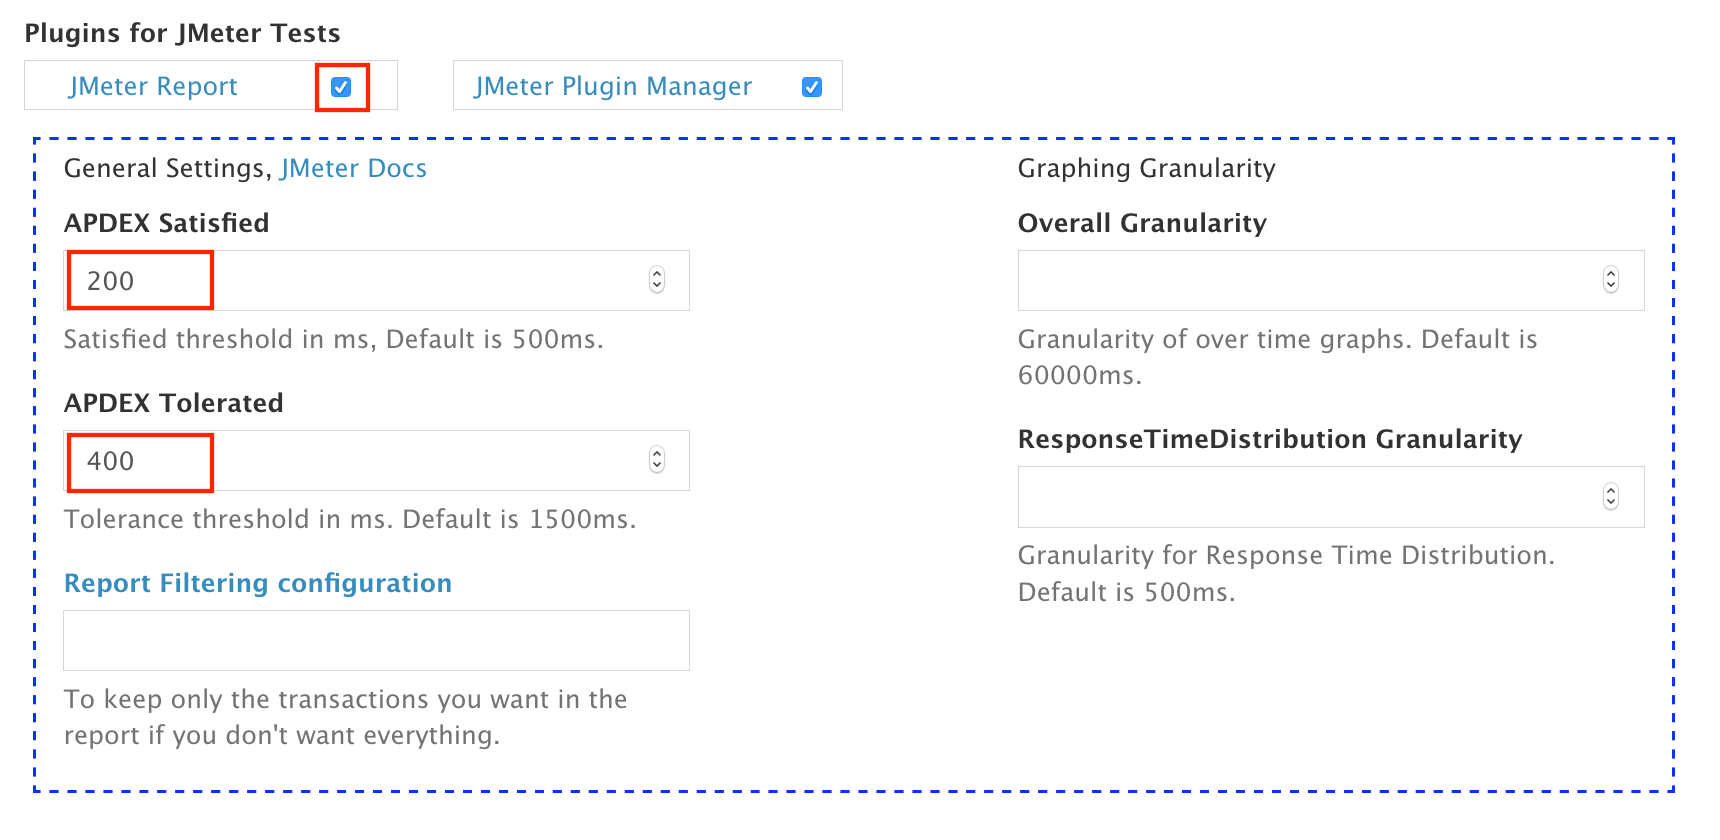
More readable and detailed reporting
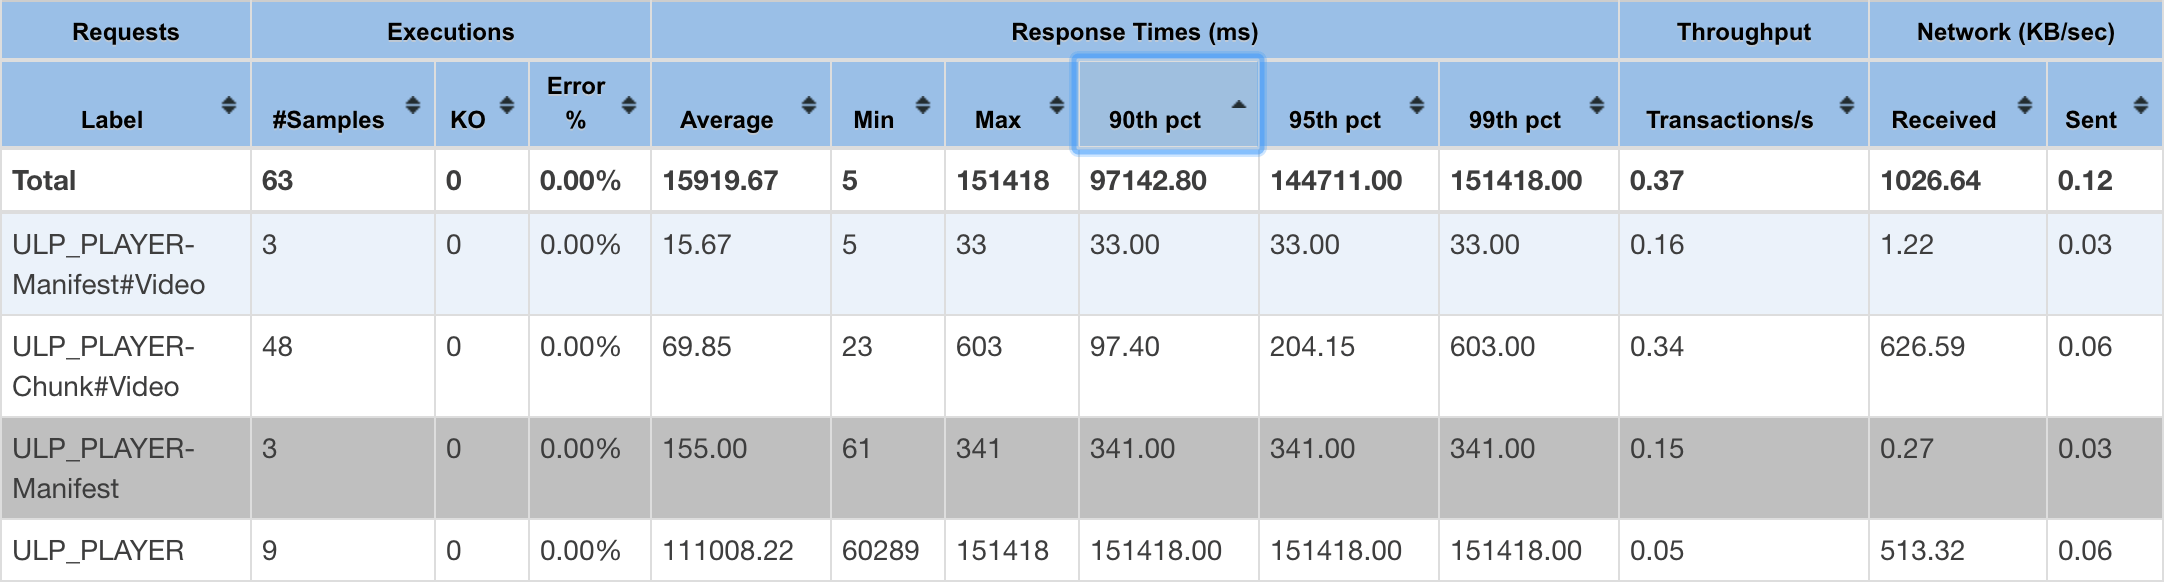
Sample results are now reported by types (Manifest/Chunks) and content (Video/Audio/Subtitles).
This makes the JMeter default report much more meaningful providing:
An overview of each type’s response time with configurable percentiles (default to 3 percentiles 90, 95 and 99) as long as their error percentage, network traffic, number of calls
Response times across time for each type
Repartition of response times
Live Metrics
With this new release, the sample results are delivered as soon as they are available. It gives a better readability of the test’s progress and integrates better with PAAS Providers and tools like Taurus for CI/CD.
Another change is that the VideoStreamingSampleResult that provided the metrics at the end of the test is now returned periodically during the whole length of the test. The frequency at which this sample result is returned can be set in the UI by changing the field “VideoStreamingSampleResult Frequency”. Its default value is 60s.
Meaningful metrics and custom graphs
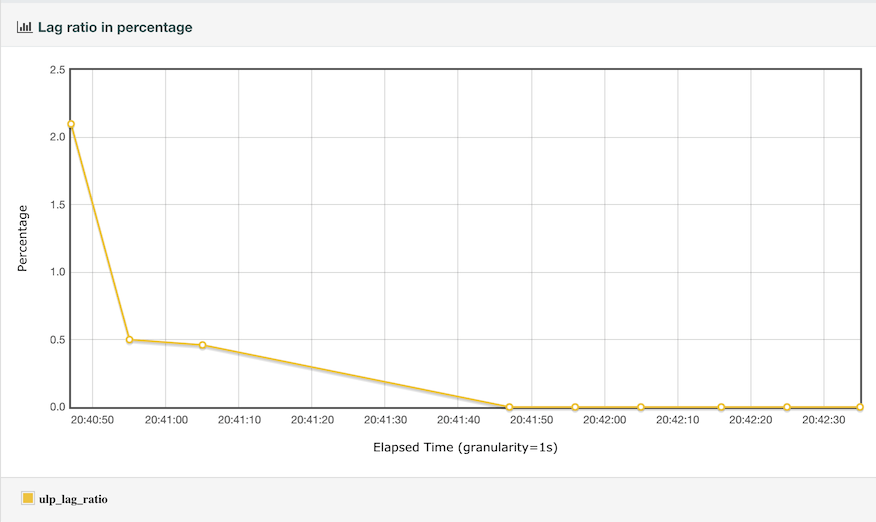
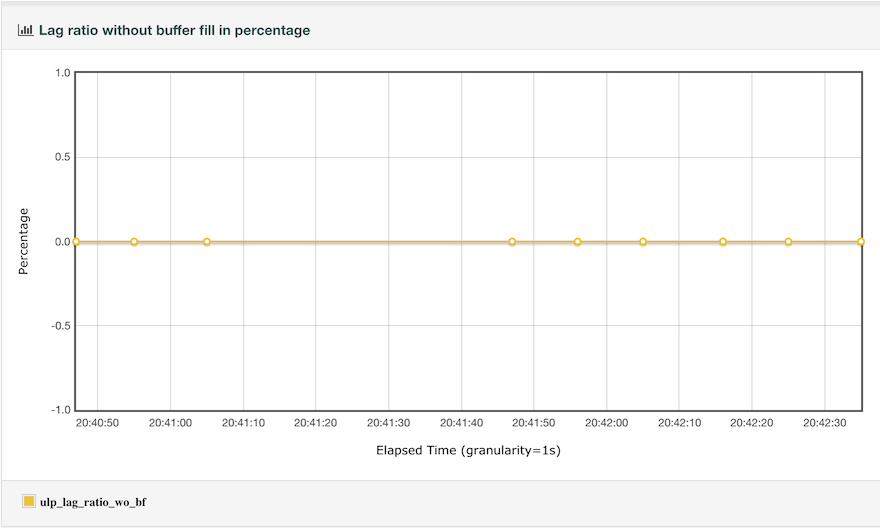
In this release, the custom metrics also have been modified. We have added the lag ratio without the buffer fill time.
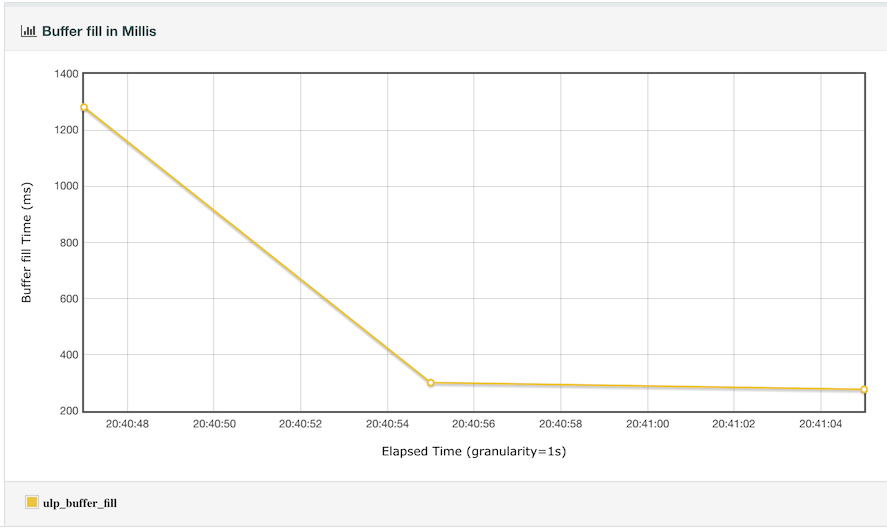
This new metric is brought along a custom graph which represent the lag ratio without the buffer fill time over time.
Some custom graphs that previously existed have been removed as they were not necessary anymore as the renaming of the sample result made them redundant with the graphs already available.
DASH
The plugin supports new tag from the DASH manifest :
<Role> tag in the <AdaptationSet> tag. This allows the plugin to determine whether the track is default or not
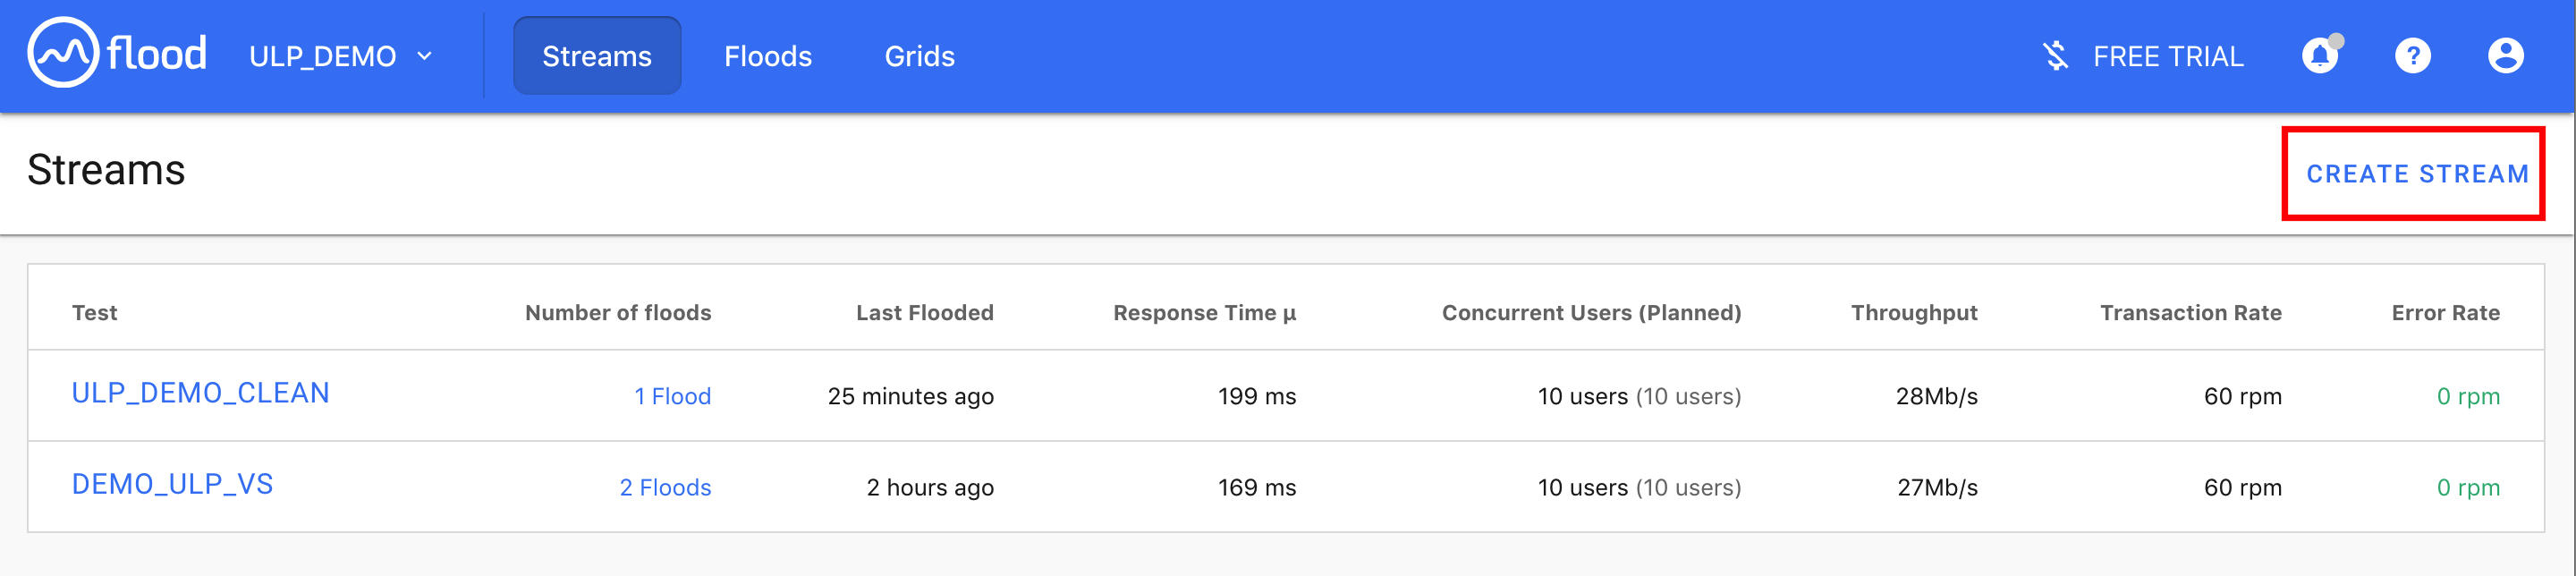
Running a Video Streaming Performance Test using Flood.io and UbikLoadPack
In this blog, we will see how to run a Video Streaming Performance Test using Flood.io and UbikLoadPack to check the performances of a platform delivering one of the following formats:
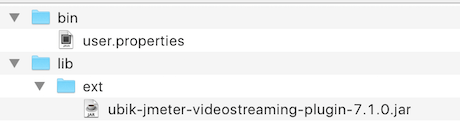
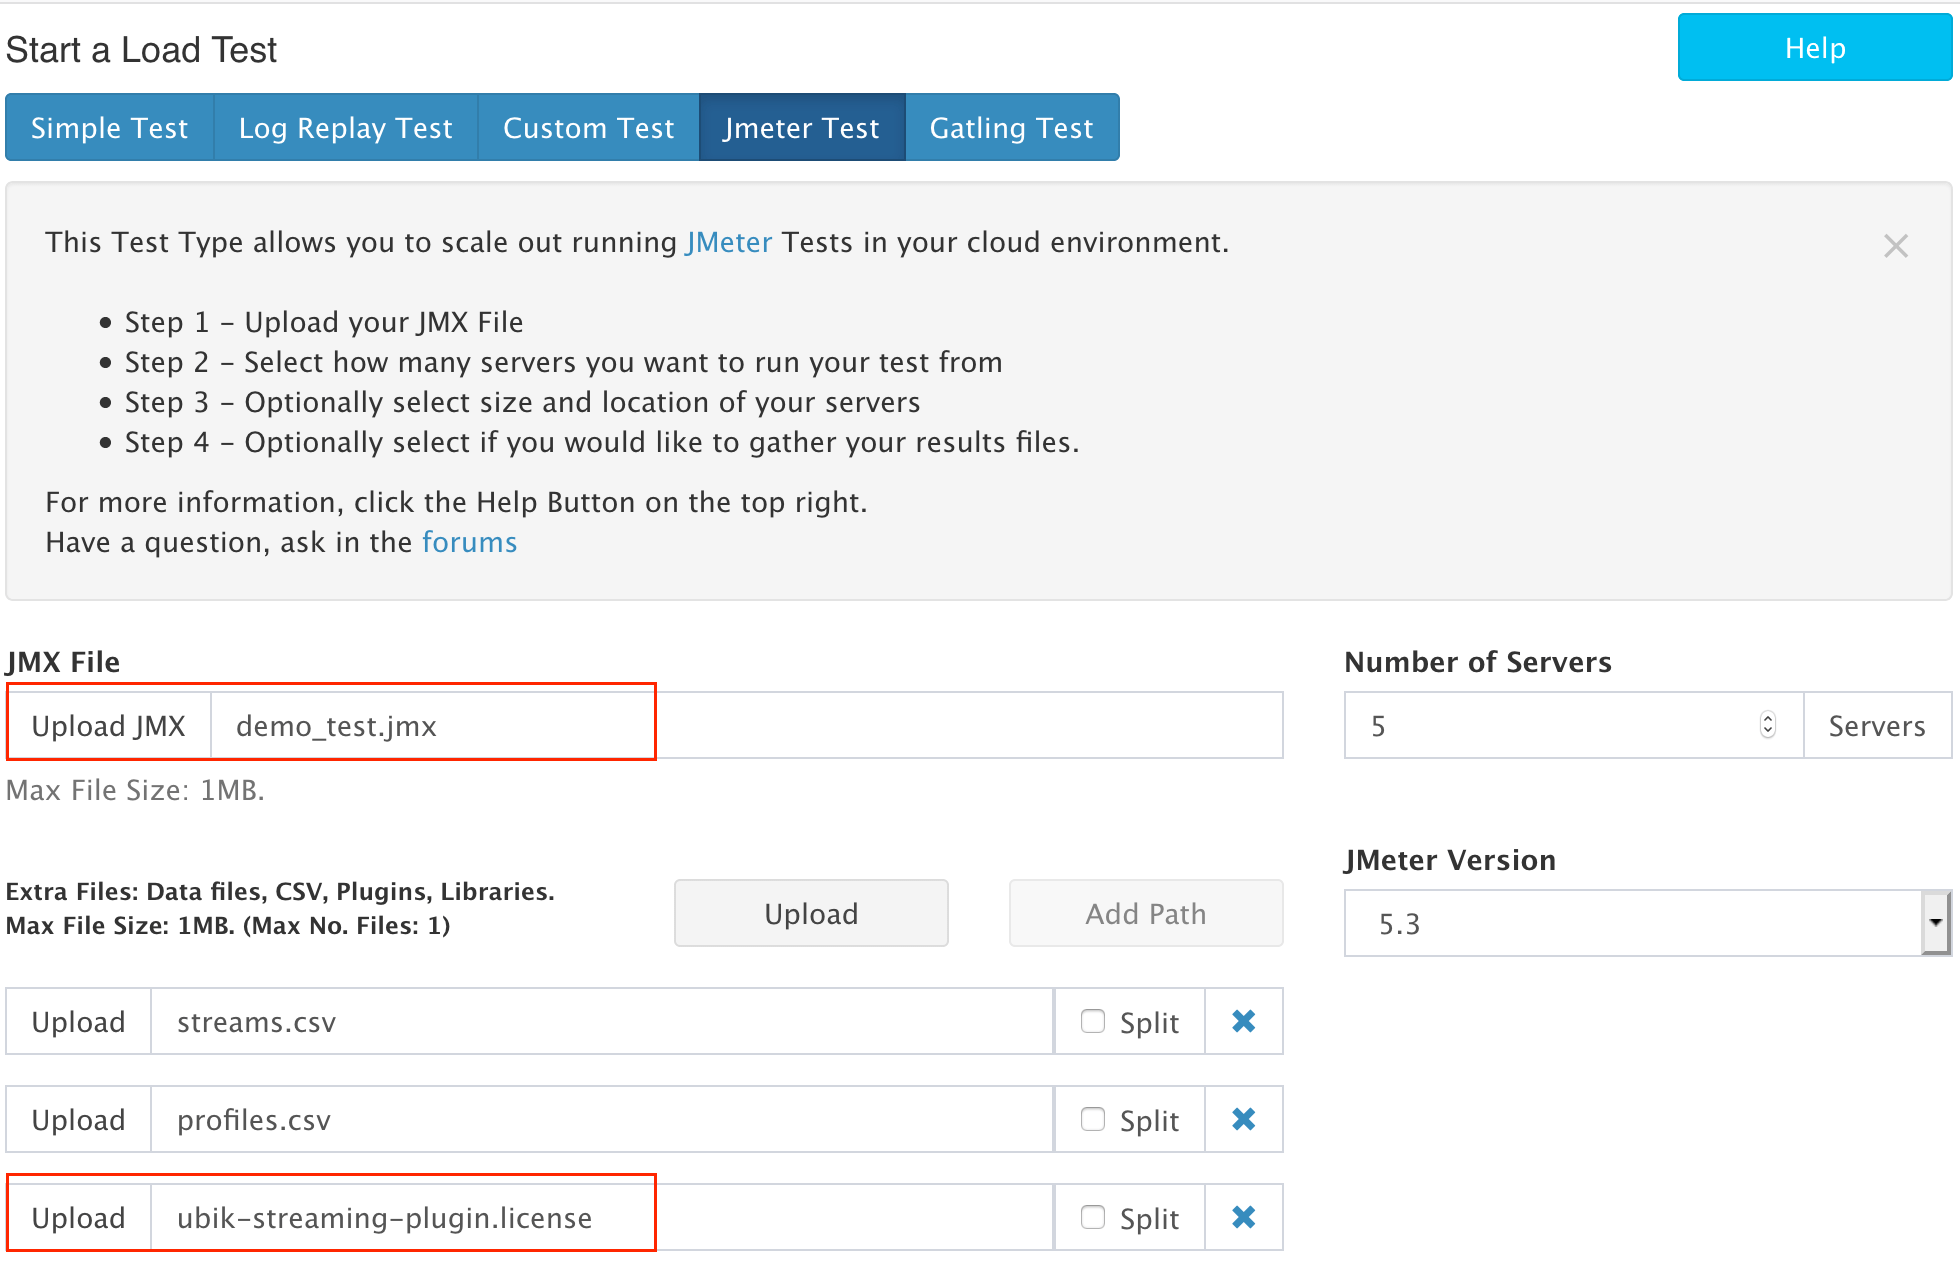
Request a trial version of UbikLoadPack Video Streaming Plugin, you’ll receive a mail with an attached trial license and a link to download the bundle.
The JMeter test plan
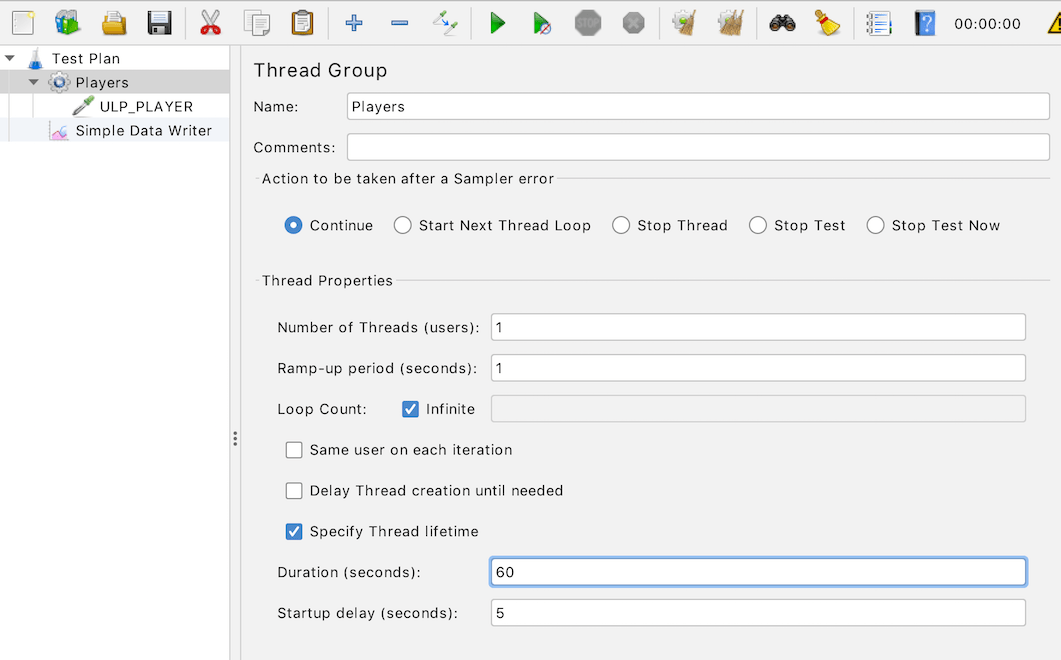
We’ll use a very simple test plan :
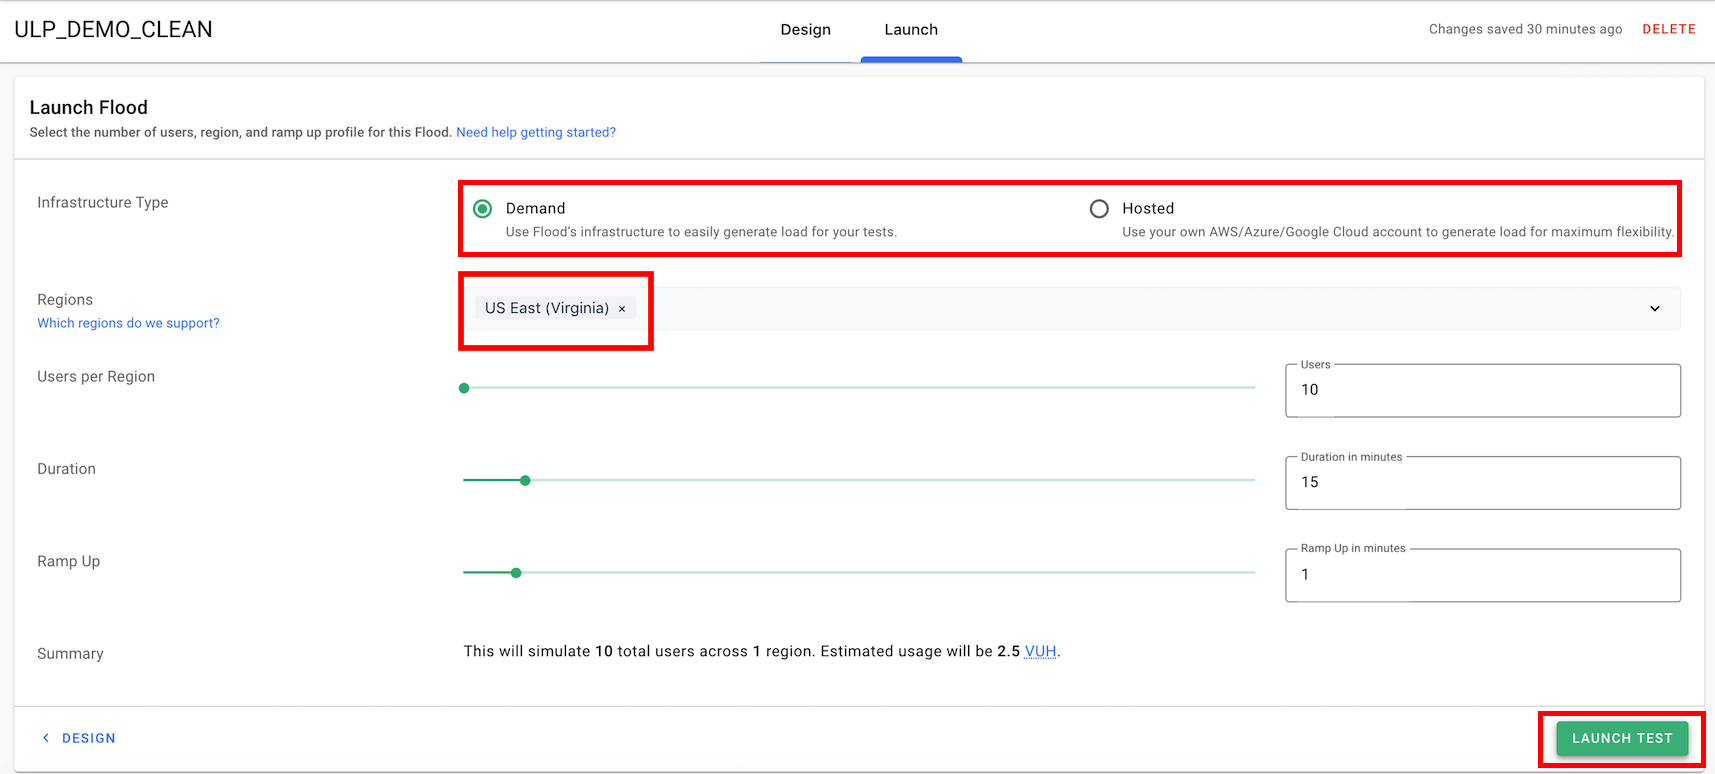
Note that we don’t configure anything in Thread Group regarding Users Arrival and schedule as it will be done in Flood.io interface
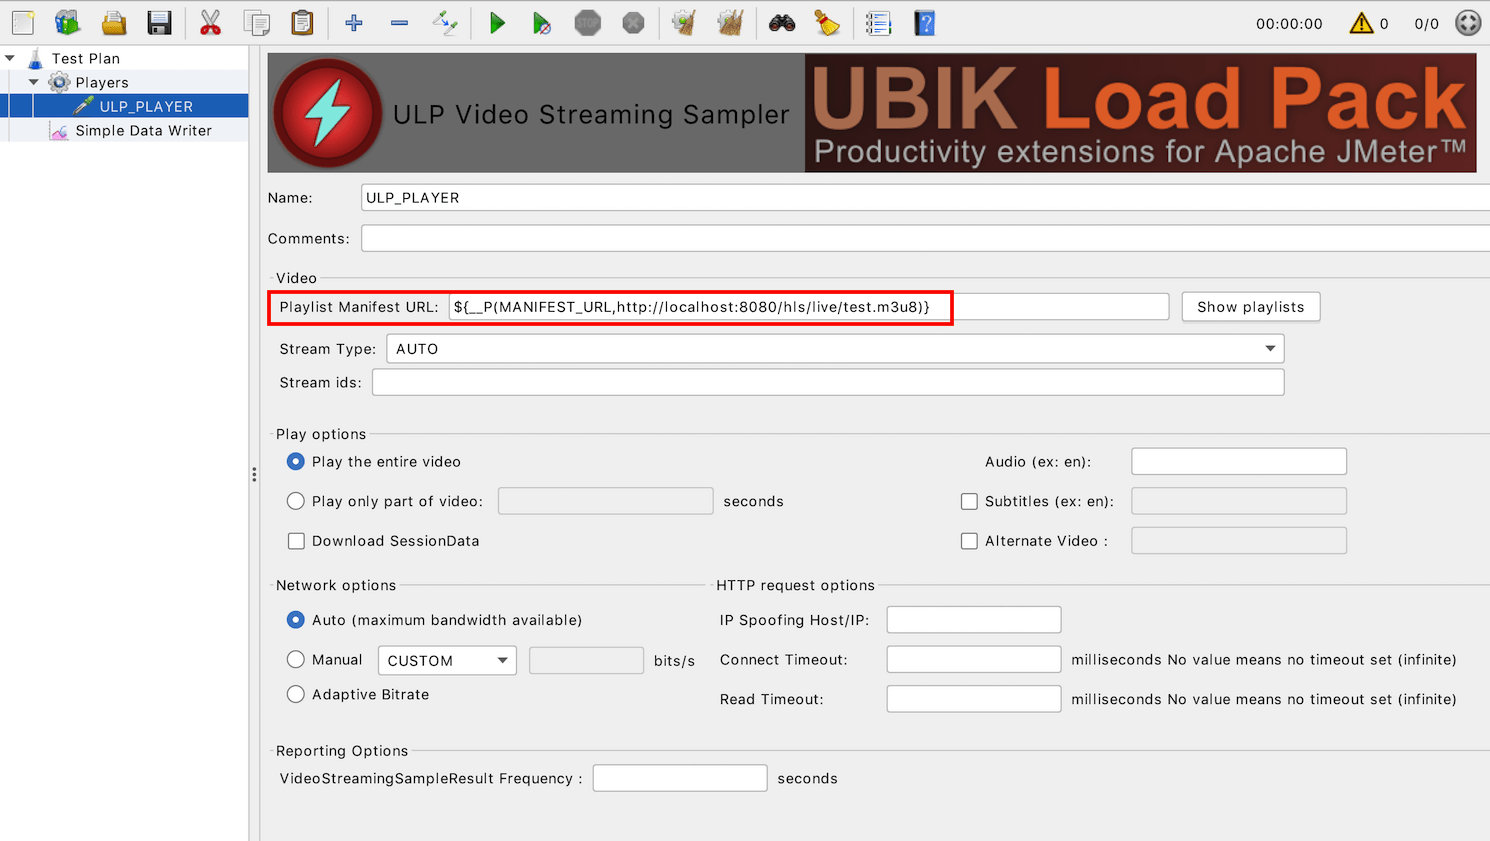
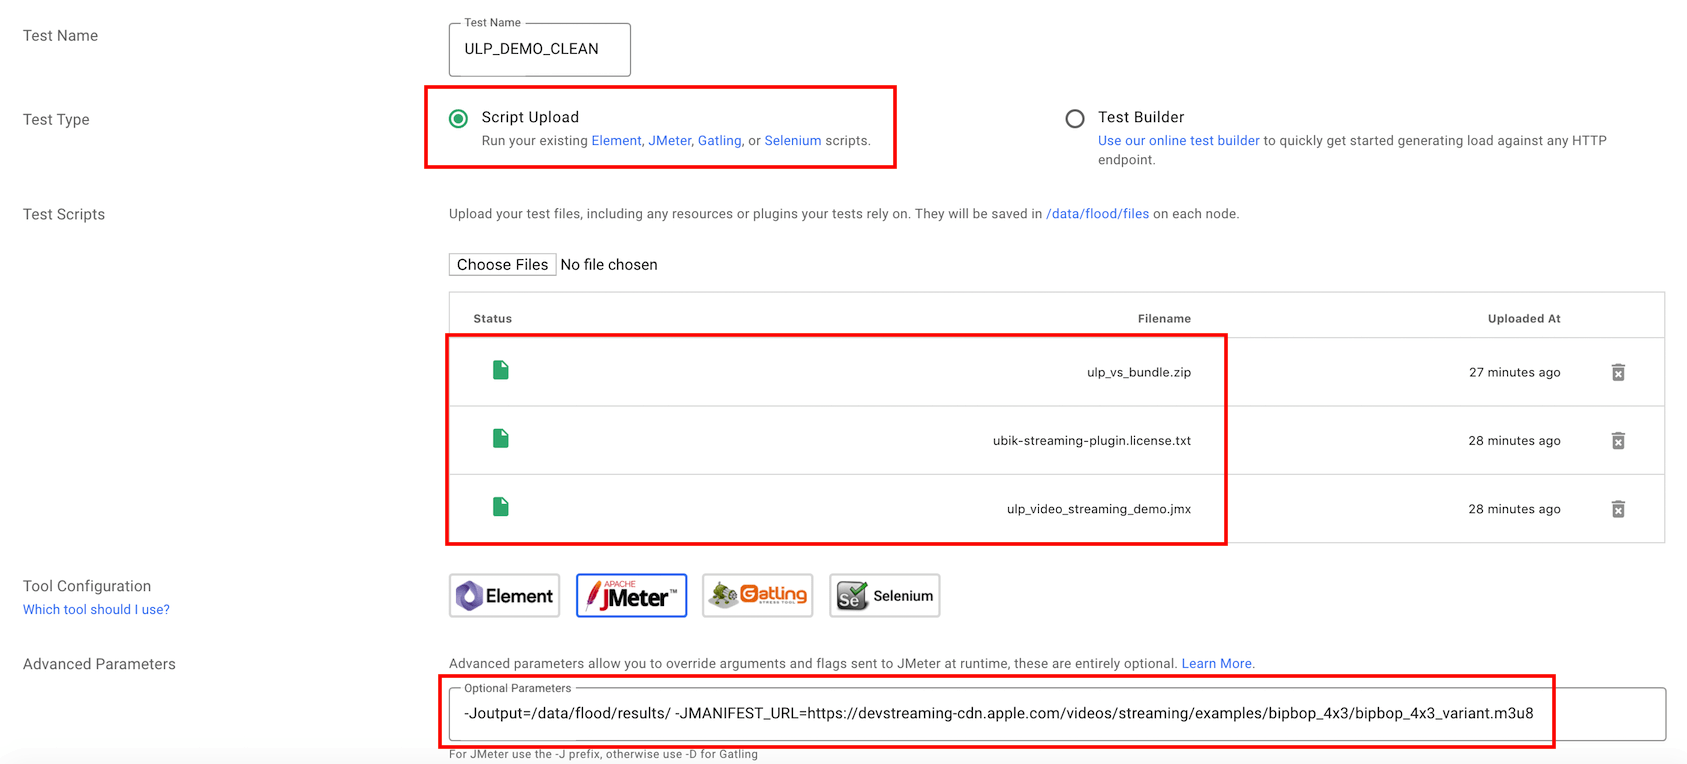
In UbikLoadPack streaming sampler we just set
Playlist URL to the HLS manifest URL (we use a propertyMANIFEST_URL to be able to modify it from outside of JMeter, it defaults to our Mock server “http://localhost:8080/hls/live/test.m3u8“)
UbikLoadPack Video Streaming Sampler
Testing your own Video Streaming servers
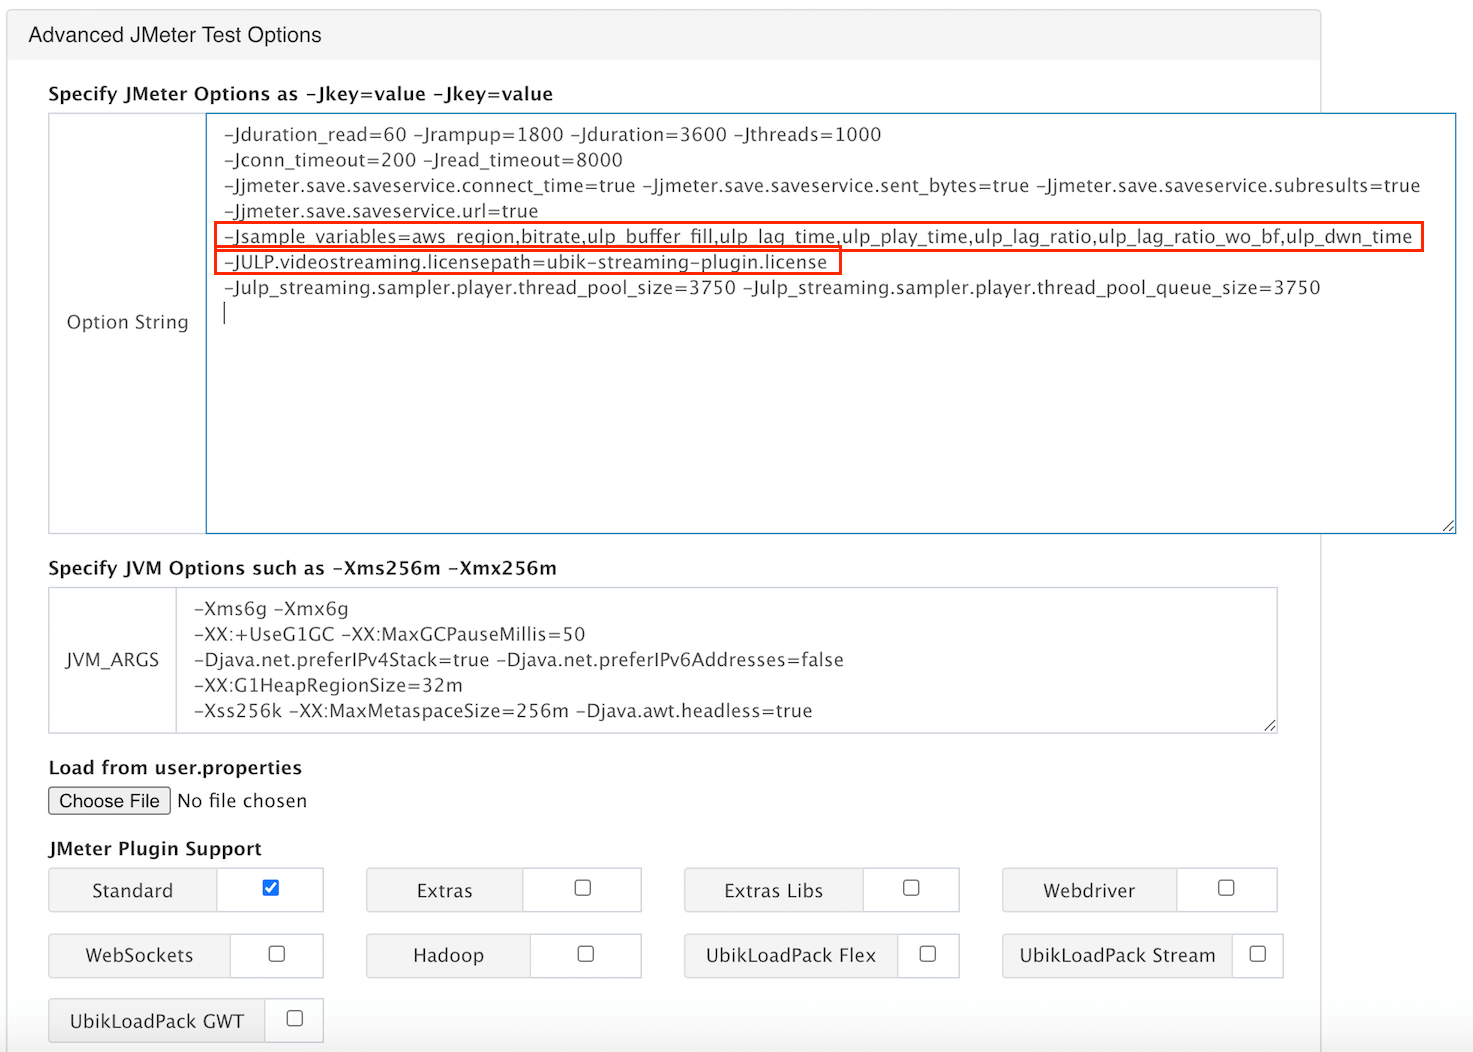
If you want to test your own servers, just pass in Advanced parameters of flood IO Stream configuration, for example:
Plugin which provides the ability to easily load test GWT based applications using Apache JMeter.
It provides the following features:
Record and transform GWTRPC requests to XML
Out of the box transformation of requests from XML back to GWTRPC
On-demand transformation of responses from GWTRPC to XML for optional extraction
On demand transformation of requests from Java objects back to GWTRPC
On-demand transformation of responses from GWTRPC to Java for optional extraction
Assertion on GWT response to check they are OK
View Results Tree renderer to test XPath extractions of data from GWTRPC responses
Pre-requisites
Get a trial license
A valid license is necessary to use the plugin, to obtain it:
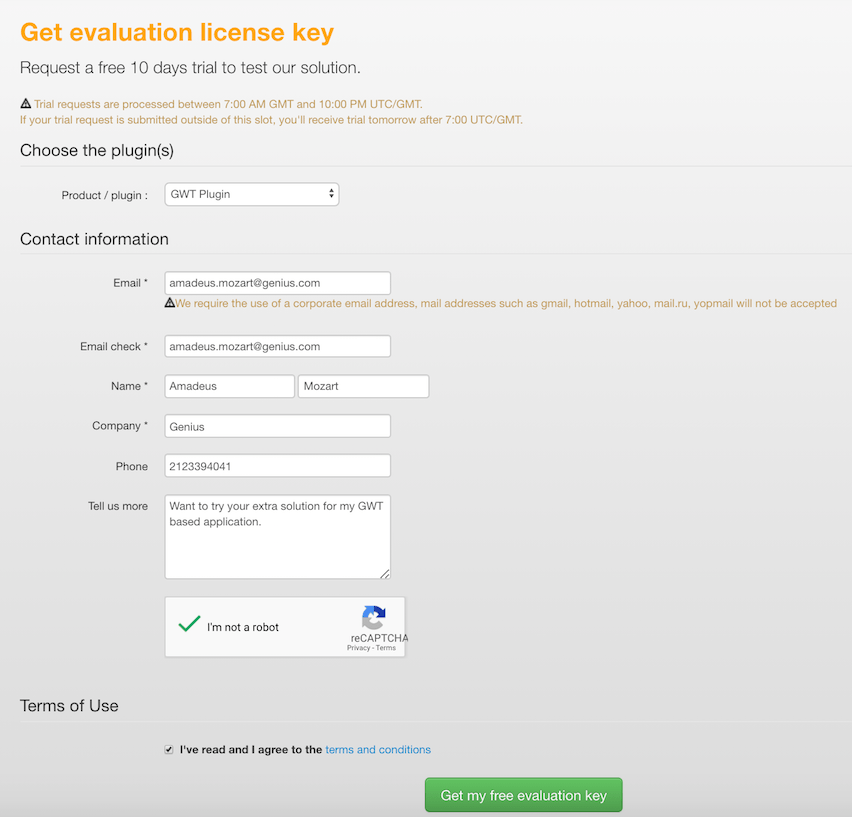
Ask for a free trial license by checking this link
Select the GWT Streaming plugin in the drop box and fill the requested fields (double check your e-mail and ensure you fill in the two check boxes for Robot detection and “terms and conditions”)
Click on the button “Get my free evaluation key” and wait for the email delivering the trial license
Installation
Via PluginsManager
If you have not installed jmeter-plugins yet: get the jar from here
put it in jmeter/lib/ext directory
if you’re behind an enterprise proxy with (for example) the following configuration:proxyHost : my.proxy.server
proxyPort : 8000
proxyUser : user
proxyPassword : pass
use the following command to launch Apache JMeter :
Windows : set JVM_ARGS="-Dhttps.proxyHost=my.proxy.server -Dhttps.proxyPort=8000 -Dhttp.proxyUser=user -Dhttp.proxyPass=pass" && %JMETER_HOME%\jmeter.bat
If you experiencing “Connection Timed Out” errors, you can set this property in the user.properties file: jpgc.repo.timeout=120000
Restart JMeter
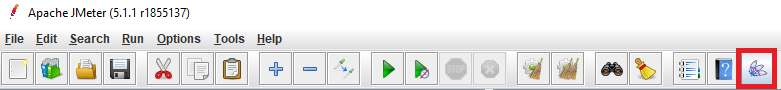
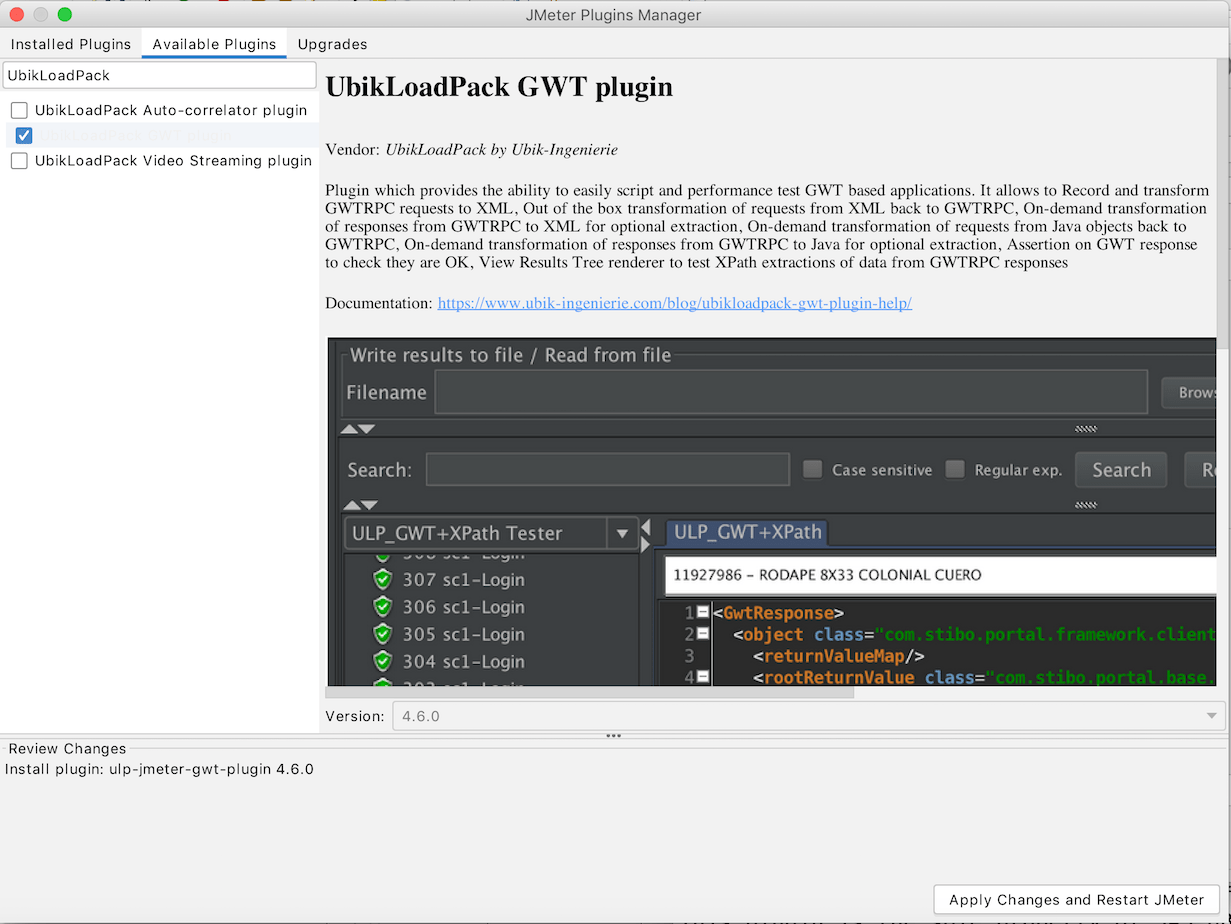
In JMeter, open the plugin manager (icon on the far right)
In the “Available Plugins” tab and in the search field enter the term “UbikLoadPack”
Select the UbikLoadPack GWT Streaming plugin
Click the “Apply Changes and Restart JMeter” button
Via Trial mail
The trial mail contains the link to the bundle that you can download then:
Unzip ulp_gwt-plugin-XXX.zip
if your version of gwt is >= 2.0 copy the bundle’s lib/ext/ubik-jmeter-gwt-plugin-above2-X.X.X.jar to the lib/ext directory of your Apache JMeter installation
if your version of gwt is < 2.0 copy the bundle’s lib/ext/ubik-jmeter-gwt-plugin-below2-X.X.X.jar to the lib/ext directory of your Apache JMeter installation
Restart JMeter
Configure License
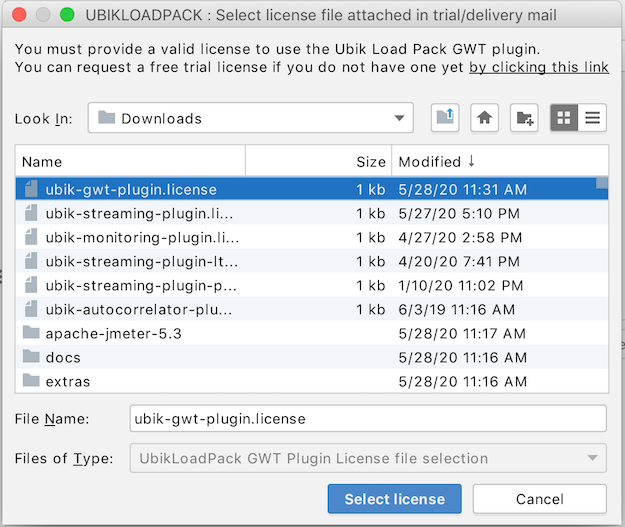
When launching Apache JMeter for the first time after the installation of the plugin, a pop up will ask for the path of the license file. Navigate to the location of your license and click on the button “Open”.
If the popup does not appear, open the user.properties file in the bin folder of your Apache JMeter installation and modify the following property:
The plugin requires your application jars to be able to work.
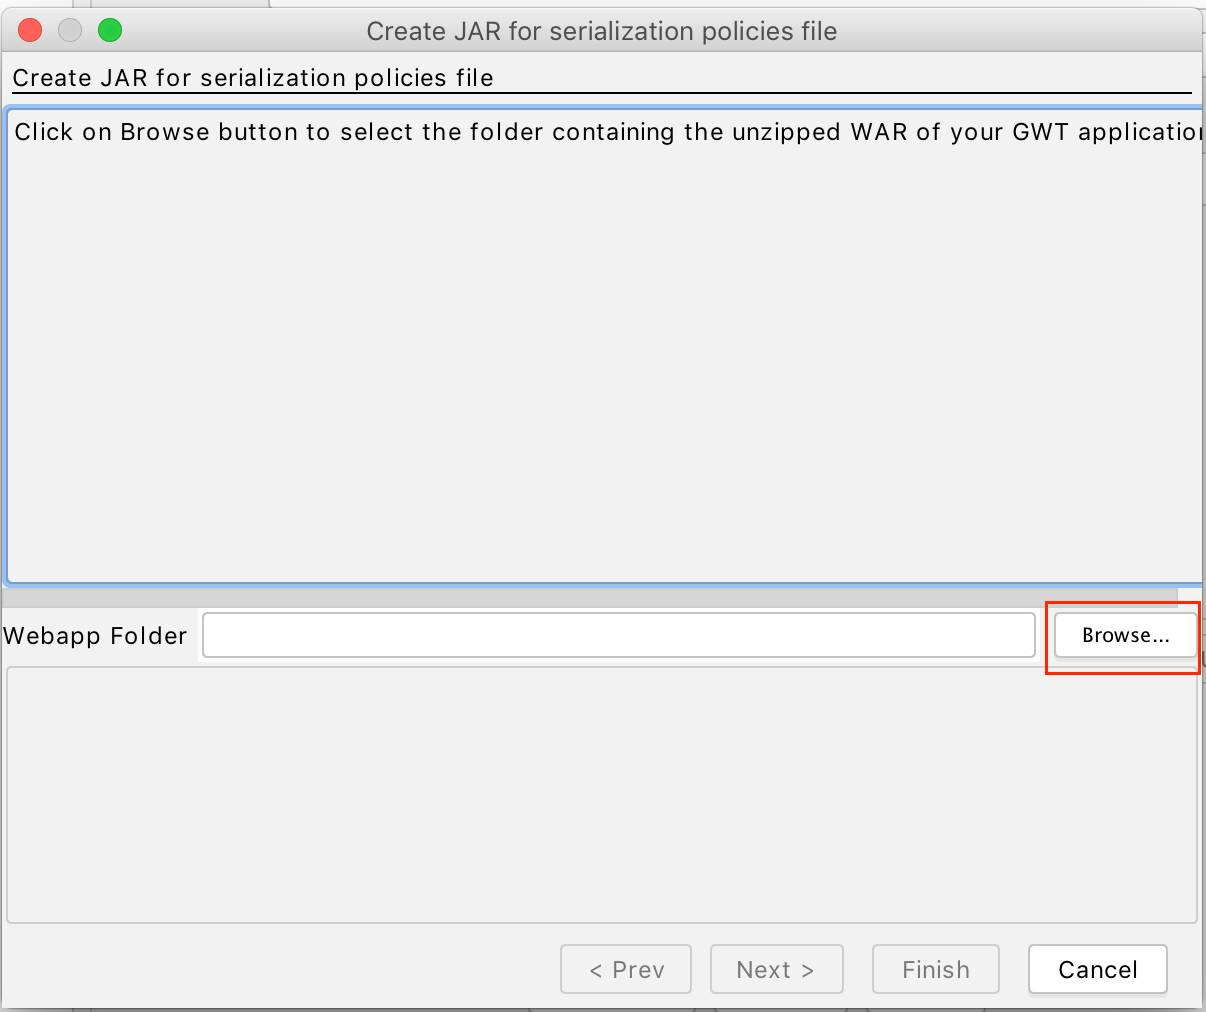
Use Menu Help > ULP:Collect JARs from application
ULP:Collect JARs from application
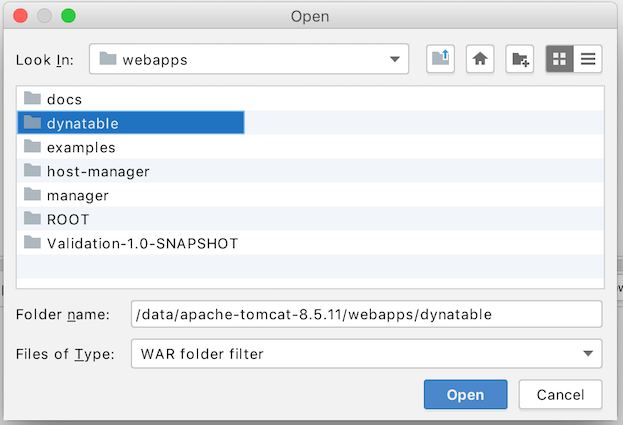
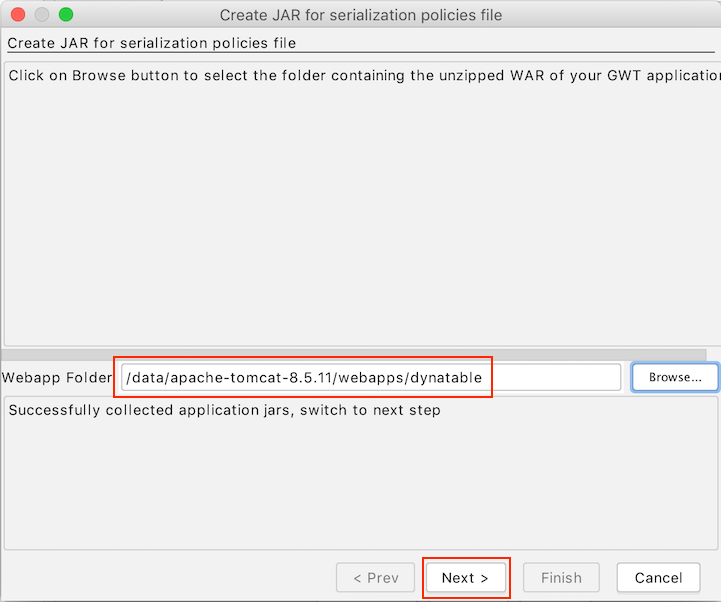
Click on Browse and select the folder containing the expanded (unzipped) WAR archive of your application:
Select Unzipped WAR archiveSuccessful execution of jars collection
If selection is correct, Next button will be enabled and you’ll notice the message saying “Successfully collected application jars, switch to next step” click on it:
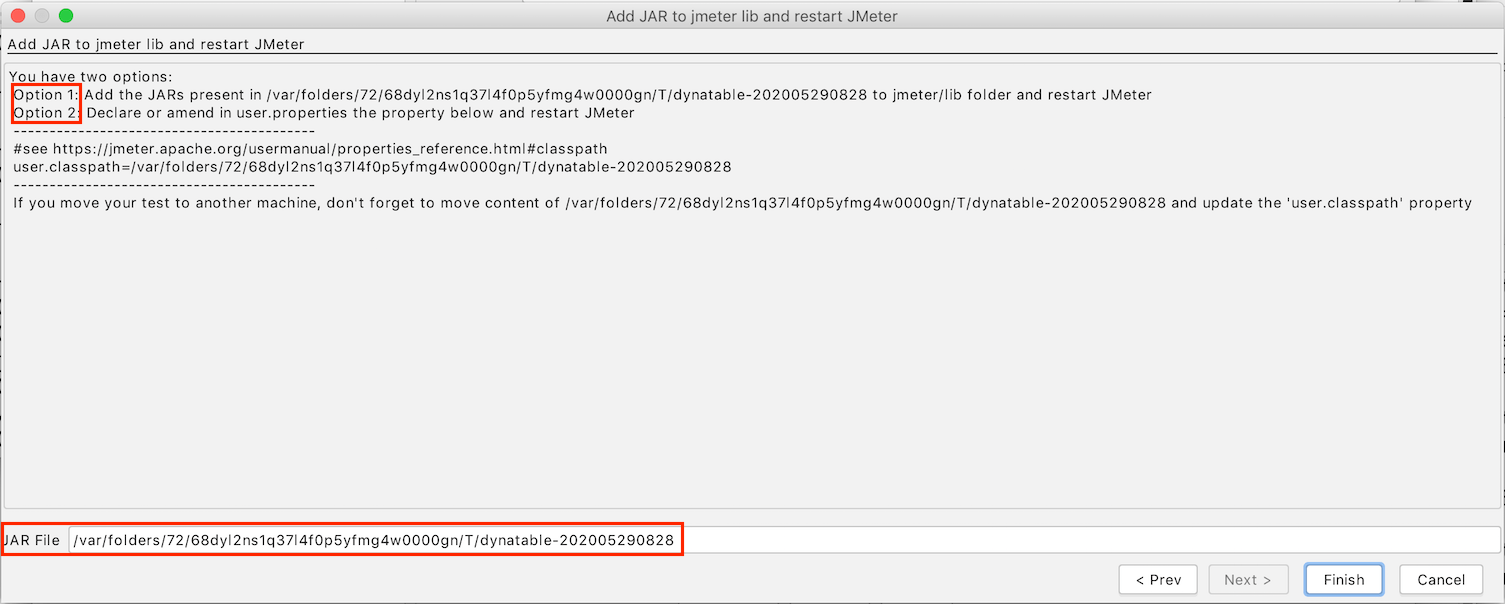
Wizard step 2
The wizard shows the name of the folder that contains the collected application jars and classes and give you two options.
Option 1:
Add the jars in this folder to jmeter/lib
Option 2
Move the folder out of Temp folder and then reference it in jmeter/bin/user.properties using user.classpath
This option is preferable if your application is composed of many jars, it will also allow you to isolate JMeter jars from the application jars easing upgrades.
Example of user.properties:
user.classpath=/<your work folder>/dynatable-202005290851
Where content of would be:
ls -ltr /<your work folder>/dynatable-202005290851
total 18400
-rw-r--r--  1 PhilM  staff  9332290 Apr  4  2018 gwt-servlet.jar
-rw-r--r--  1 PhilM  staff    47653 Apr  4  2018 gwt-servlet-deps.jar
-rw-r--r--  1 PhilM  staff    36144 May 29 08:51 dynatable-202005290851-classes.jar
We’re proud to announce the release of major version 4.6.0 of our GWT performance testing plugin for Apache JMeter.
This plugin allows easy scripting of GWT RPC technology and performance testing at high scale using JMeter, the famous OSS Performance tool by Apache Software Foundation.
Support of Apache JMeter 5.3
We’ve added support for last version of Apache JMeter 5.3 which brings many enhancements, a nice new UI and continues to simplify the performance plugin process.
We’re proud to announce the release of version 7.1.7 of our performance testing tool for Video Streaming (HLS, MPEG-DASH, HSS, HDS).
We’ll see in this blog what new features this release brings.
Start video playing at an offset
The new feature implemented in this release is the possibility to start your VOD stream playing at an offset. This means that the player will not start playing the video at its start but at the requested time.
This makes the simulation much more realistic as previously and always as easy.
Let’s see with an example what it means for the plugin :
We will base this example on a stream with a segment duration of 6s. If the start offset is 35s then, the plugin will start playing from the 5th segment available in the manifest.
If the value of start offset is not set, then the player will play the video from the beginning.
Note: this feature is only available for VOD streams
Restart the video where it previously stopped
Another feature implemented is the possibility to restart the video where it stopped in the previous loop.
During a test, if the player encounters an error while playing and the checkbox “Resume video between iteration” is selected, then, at the next loop, instead of restarting the video from the beginning, the plugin will restart the video where it was stopped previously.
This ensure that during a test all the fragments of the video are tested and not just the first segments.
Note: once again this feature is only available for VOD stream.
Reporting modification
We made some changes to the way the VideoStreamingSampleResult returns its response code.
If there is an error while downloading a chunk or a manifest then the error code will be PLAY_ERROR
If the lag ratio without buffer fill is more than zero, then the error code is LAG_ERROR (in this case the SampleResult will still be successful)
Also, the custom graphs generated by our plugin have been switched from Mean to configurable Percentile defaulting to 95.
This property can be edited in the user.properties file by using the following line :
This tutorial shows an example with containers on the same network. But if you want to use UbikLoadPack VideoStreaming Plugin with Docker on different machines a solution would be to run compose on a swarm cluster. In short :
run your Docker Engine in swarm mode
create registry and push image to distribute it to different nodes
To use UbikLoadPack VideoStreaming Plugin with Docker you can follow those steps :
Pre-requisite : Install Docker Compose
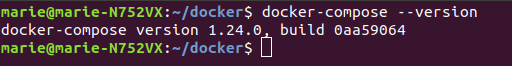
Docker Compose is used by the main executable docker/run-jmeter-in-docker.sh. Therefore you have to install it if it is not already present.
You can check if it is already installed by executing
If it is not the case, you can install it by following the instructions given by Docker documentation : Install Docker Compose
Configuration
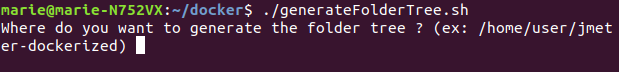
First step : Automatically generate folders
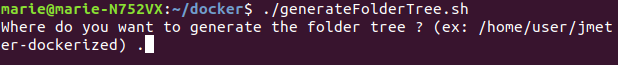
First, you have to run docker/generateFolderTree.sh to generate automatically the needed folders with right permissions. The script is going to ask you Where do you want to generate the folder tree ? (ex: /home/user/jmeter-dockerized)
Next, you just have to input the path to the folder where you want to generate those folders and press ENTER key.
Then, the script creates this folder for you if it does not already exist.
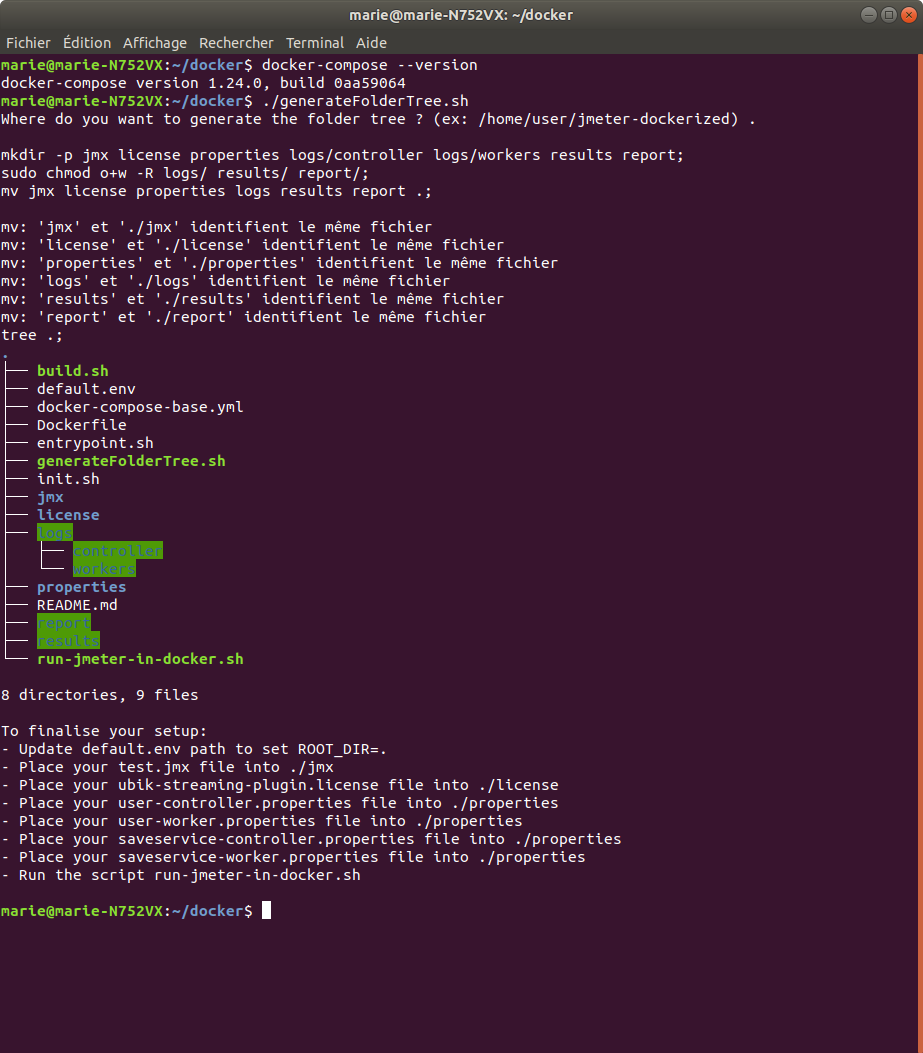
Next, it creates the folders needed for the execution of main executable docker/run-jmeter-in-docker.sh.
Those folders are :
jmx
license
properties
logs/controller
logs/workers
results
report
docker/run-jmeter-in-docker.sh will need logs, results and report to write some files. So the script gives permission to write those folders and their content for users not in your group.
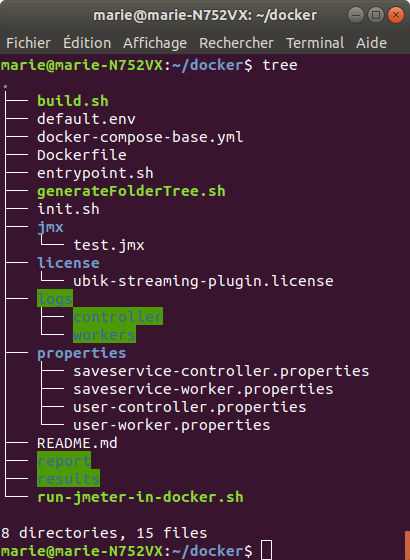
Finally, it lists the content of the directory you chose at the beginning.
And it gives you last configuration instructions.
For the second step, you just have to follow those instructions : edit and move some files. Then you will be able to use UbikLoadPack VideoStreaming Plugin with Docker by executing the last script.
Second and last step
Secondly, to finish the configuration, you have to :
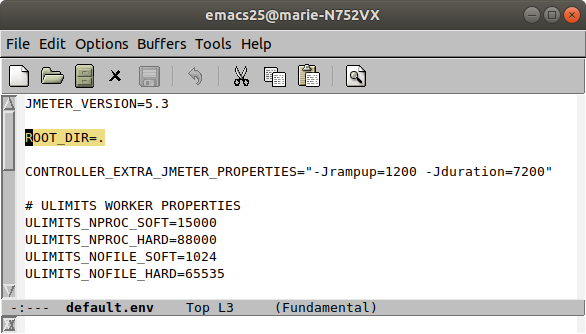
Update default.env path to set ROOT_DIR=the folder you chose during generateFolderTree.sh
Optionally, you can set JVM_ARGS_CONTROLLER and JVM_ARGS_WORKER. Controller will execute set JVM_ARGS=${JVM_ARGS_CONTROLLER} and worker set JVM_ARGS=${JVM_ARGS_WORKER} before running jmeter.
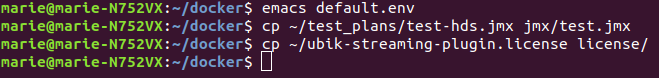
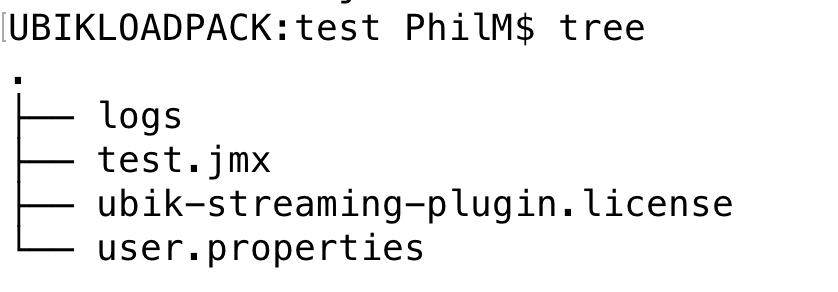
Choose the test plan you want to execute and place it in jmx folder.
You have to name this file test.jmx.
Place your UbikLoadPack VideoStreaming Plugin license in license folder and name it ubik-streaming-plugin.license
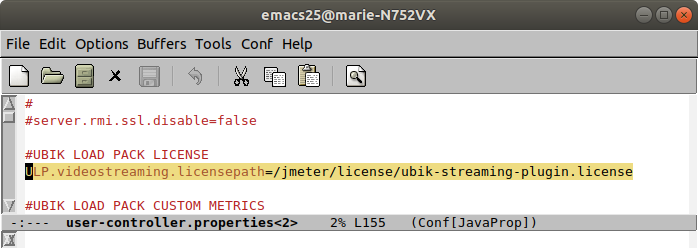
Copy twice your user.properties file and name those copies:
In both files, property ULP.videostreaming.licensepath must have the following value /jmeter/license/ubik-streaming-plugin.license.
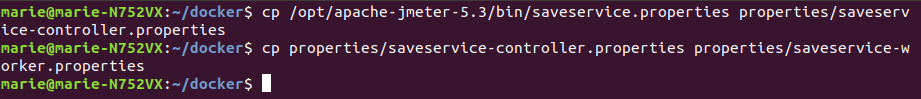
Same thing for saveservice.properties file, copy it and and name those copies:
saveservice-controller.properties
saveservice-worker.properties.
Place them in properties folder.
Workers will run jmeter with properties user-worker.properties and saveservice-worker.properties.
Respectively, controller uses user-controller.properties and saveservice-controller.properties.
To clarify, you should have following directories contents :
Run UbikLoadPack VideoStreaming Plugin with Docker
Now you finished the configuration, you can run the main executable docker/run-jmeter-in-docker.sh.
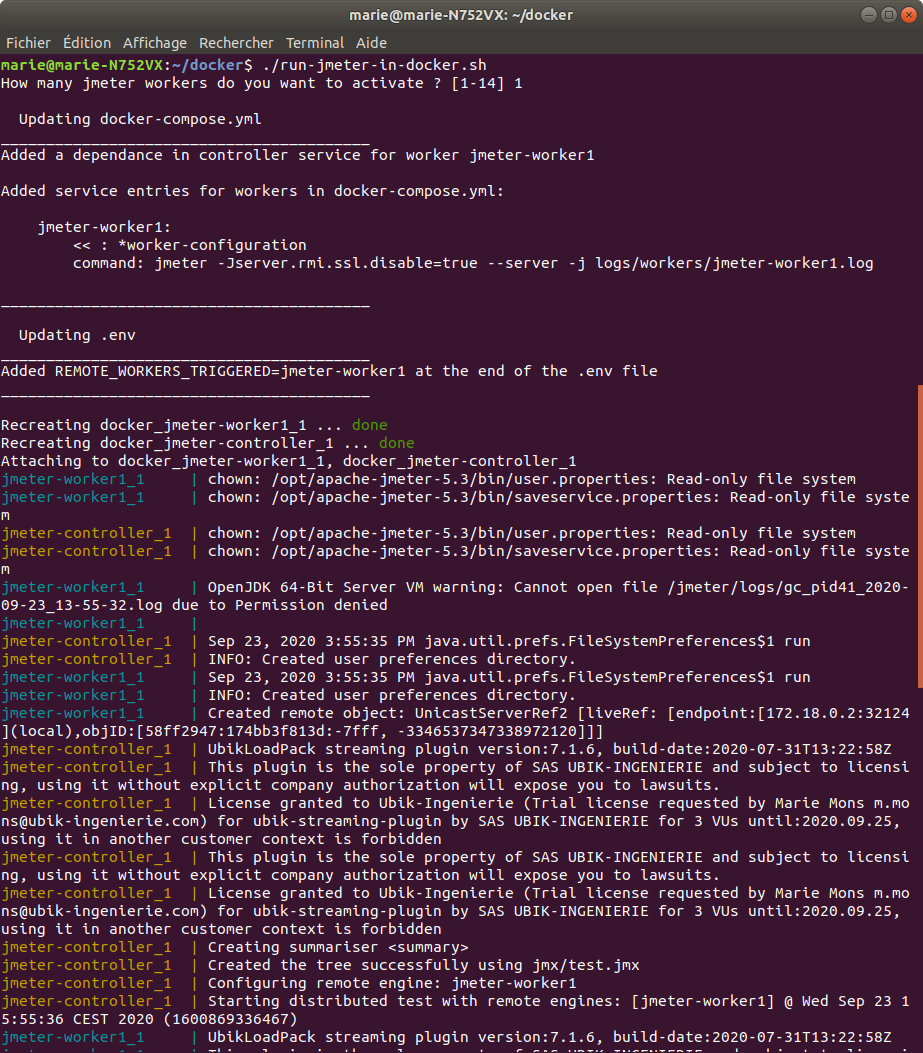
First, the script asks you How many jmeter workers do you want to activate ? [1-14]. By default the maximum number of workers is 14. If you want to change this value you can execute export MAX_WORKER_NB=value to give a value of your choice before executing this script.
Just input a number between 1 and 14, or the value you choose, included and press ENTER key.
Second, for each worker the script creates a dependance of controller for this worker. And also creates the command this worker will execute. Then it adds property REMOTE_WORKERS_TRIGGERED with value jmeter-worker1, ... to jmeter-workern, with n the number of jmeter workers.
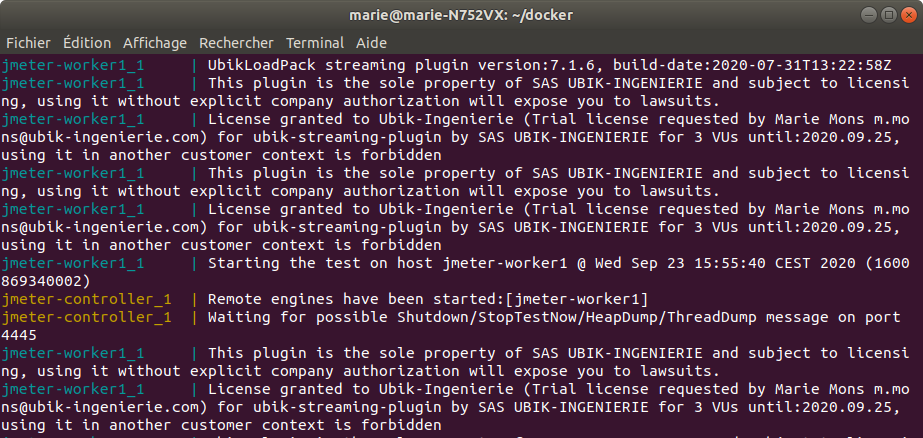
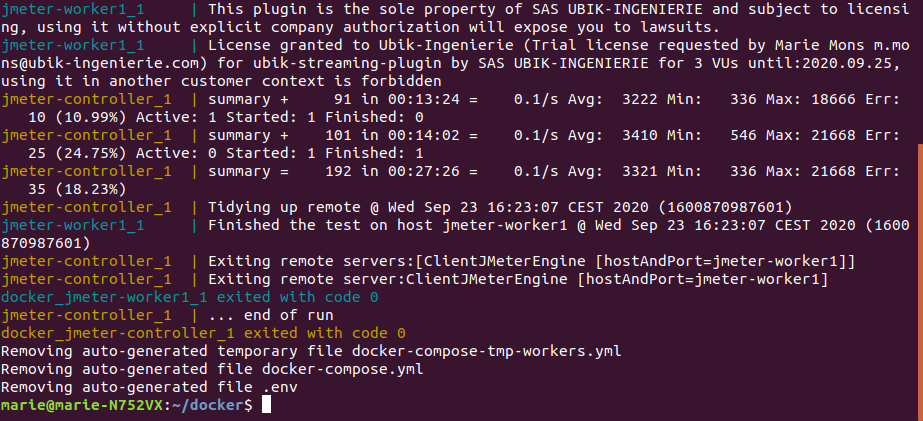
Finally, it executes docker-compose up which runs the jmeter controller.
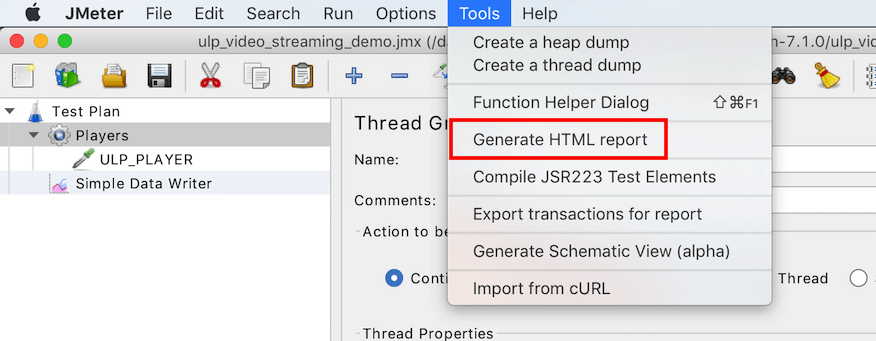
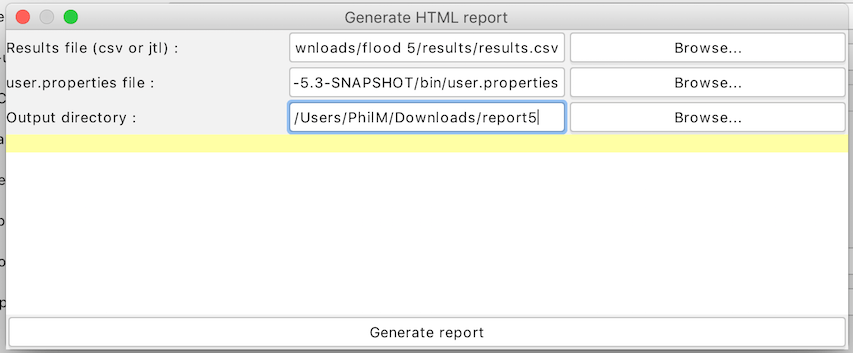
When the run finishes, you can open docker/report/index.html to view your Apache JMeter Dashboard with graphs and statistics.
get detailed JMeter HTML report after run including UbikLoadPack dedicated metrics and graphs
historize your runs
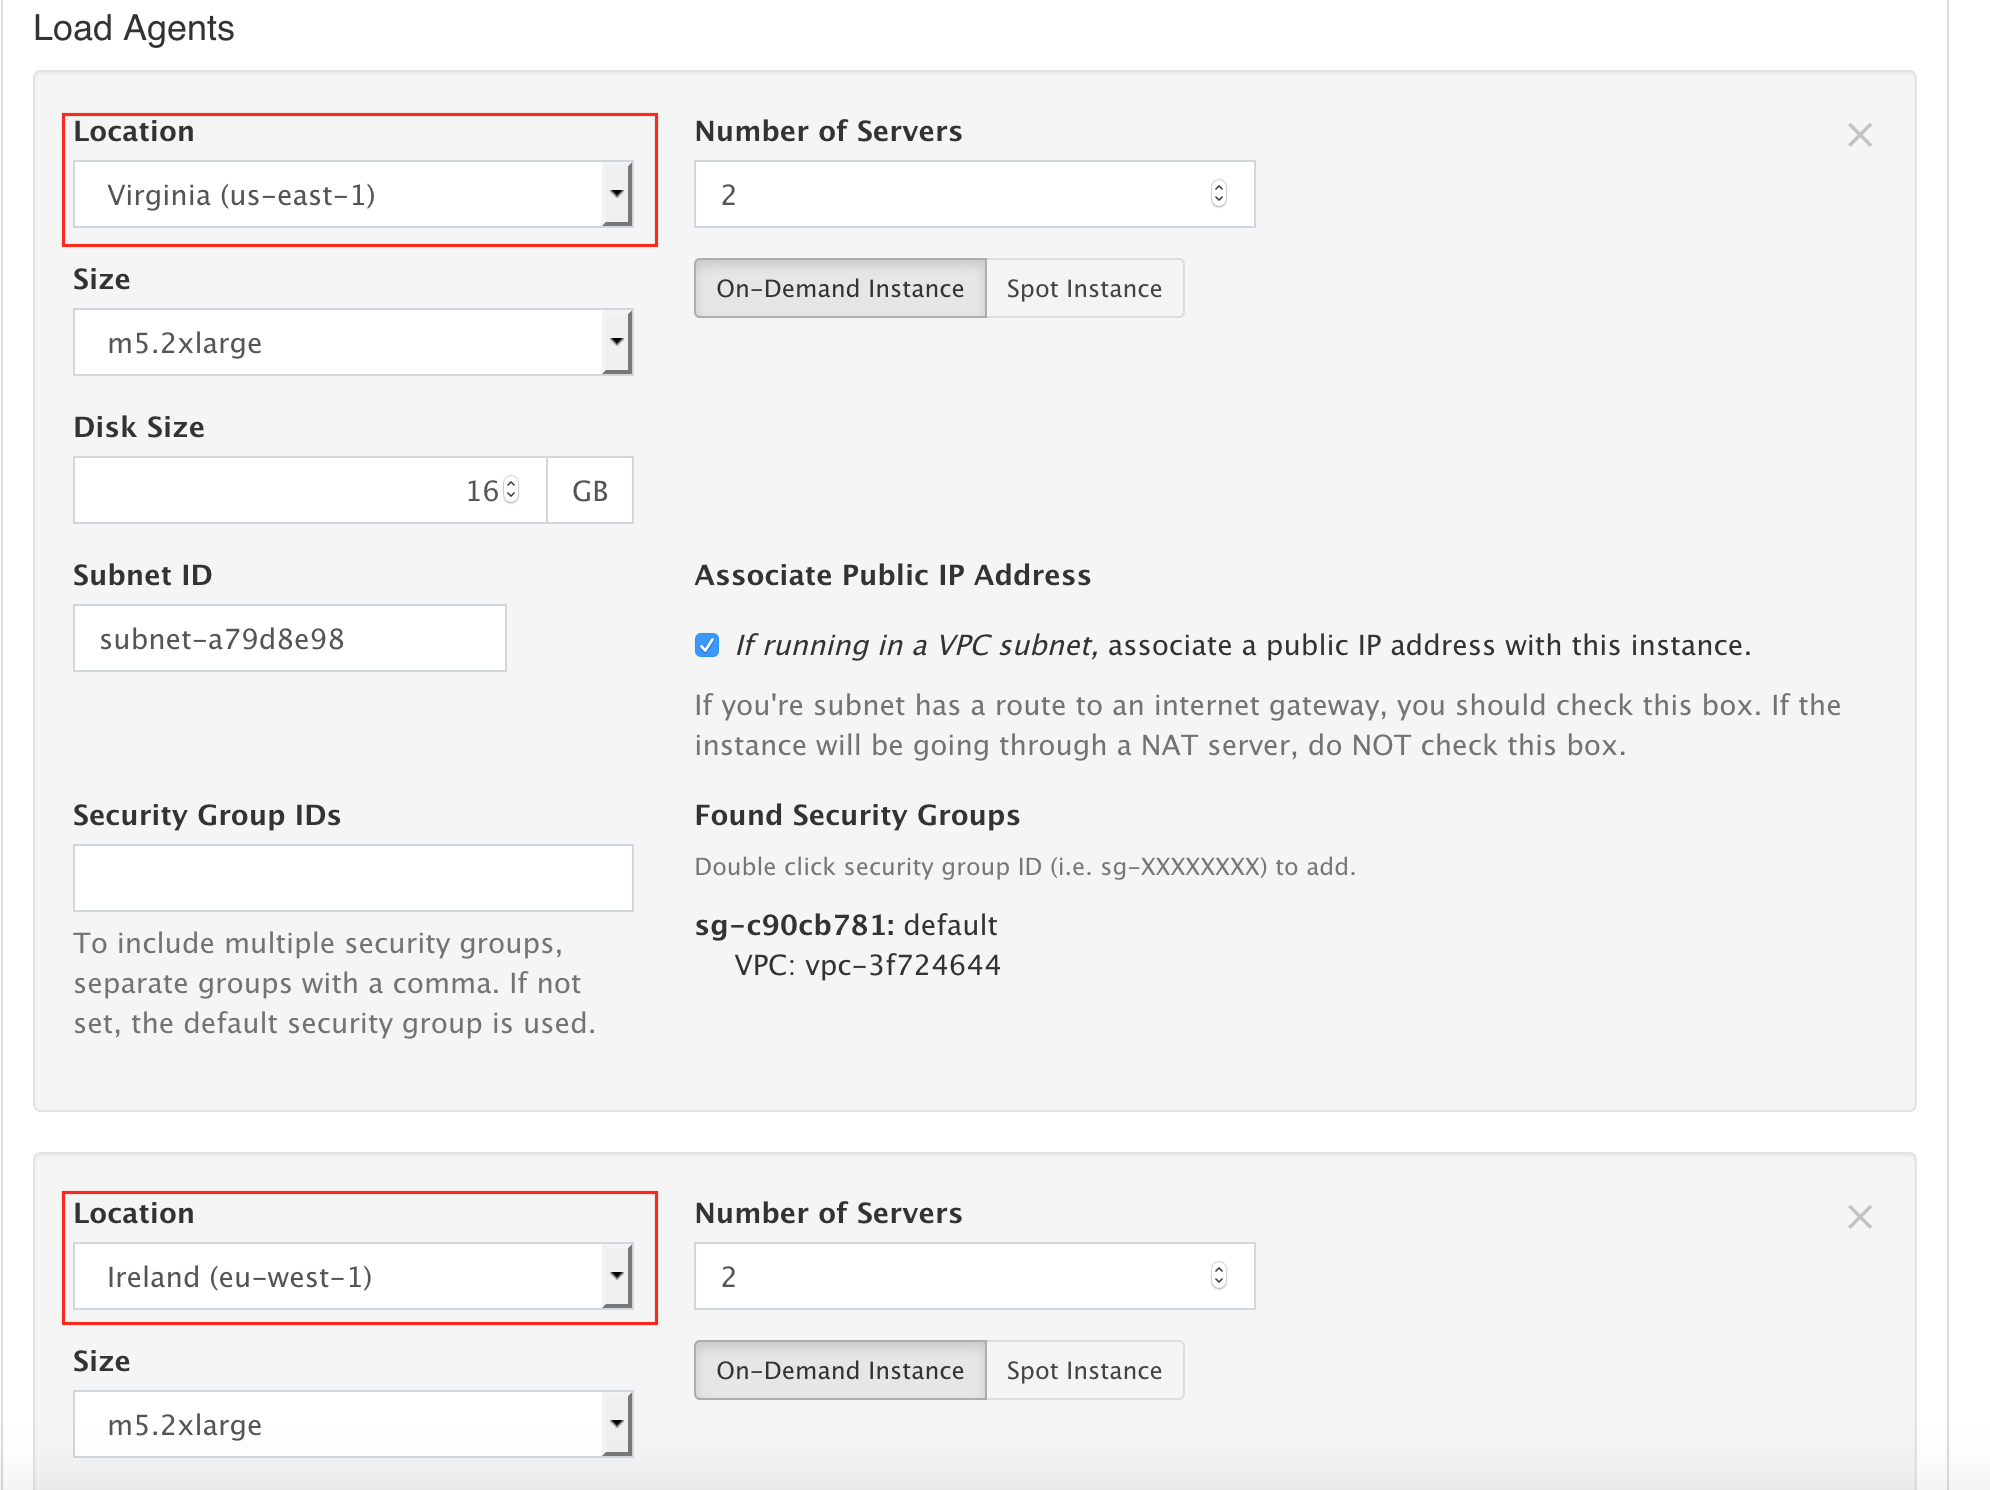
Amazon AWS as the platform for load injectors
The JMeter setup
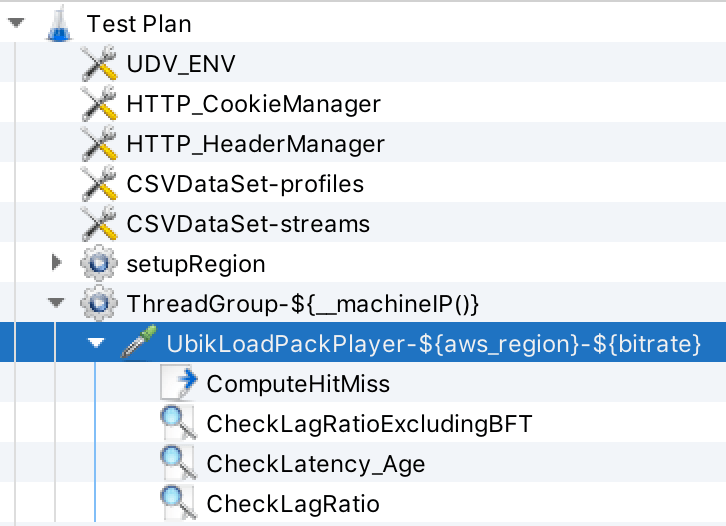
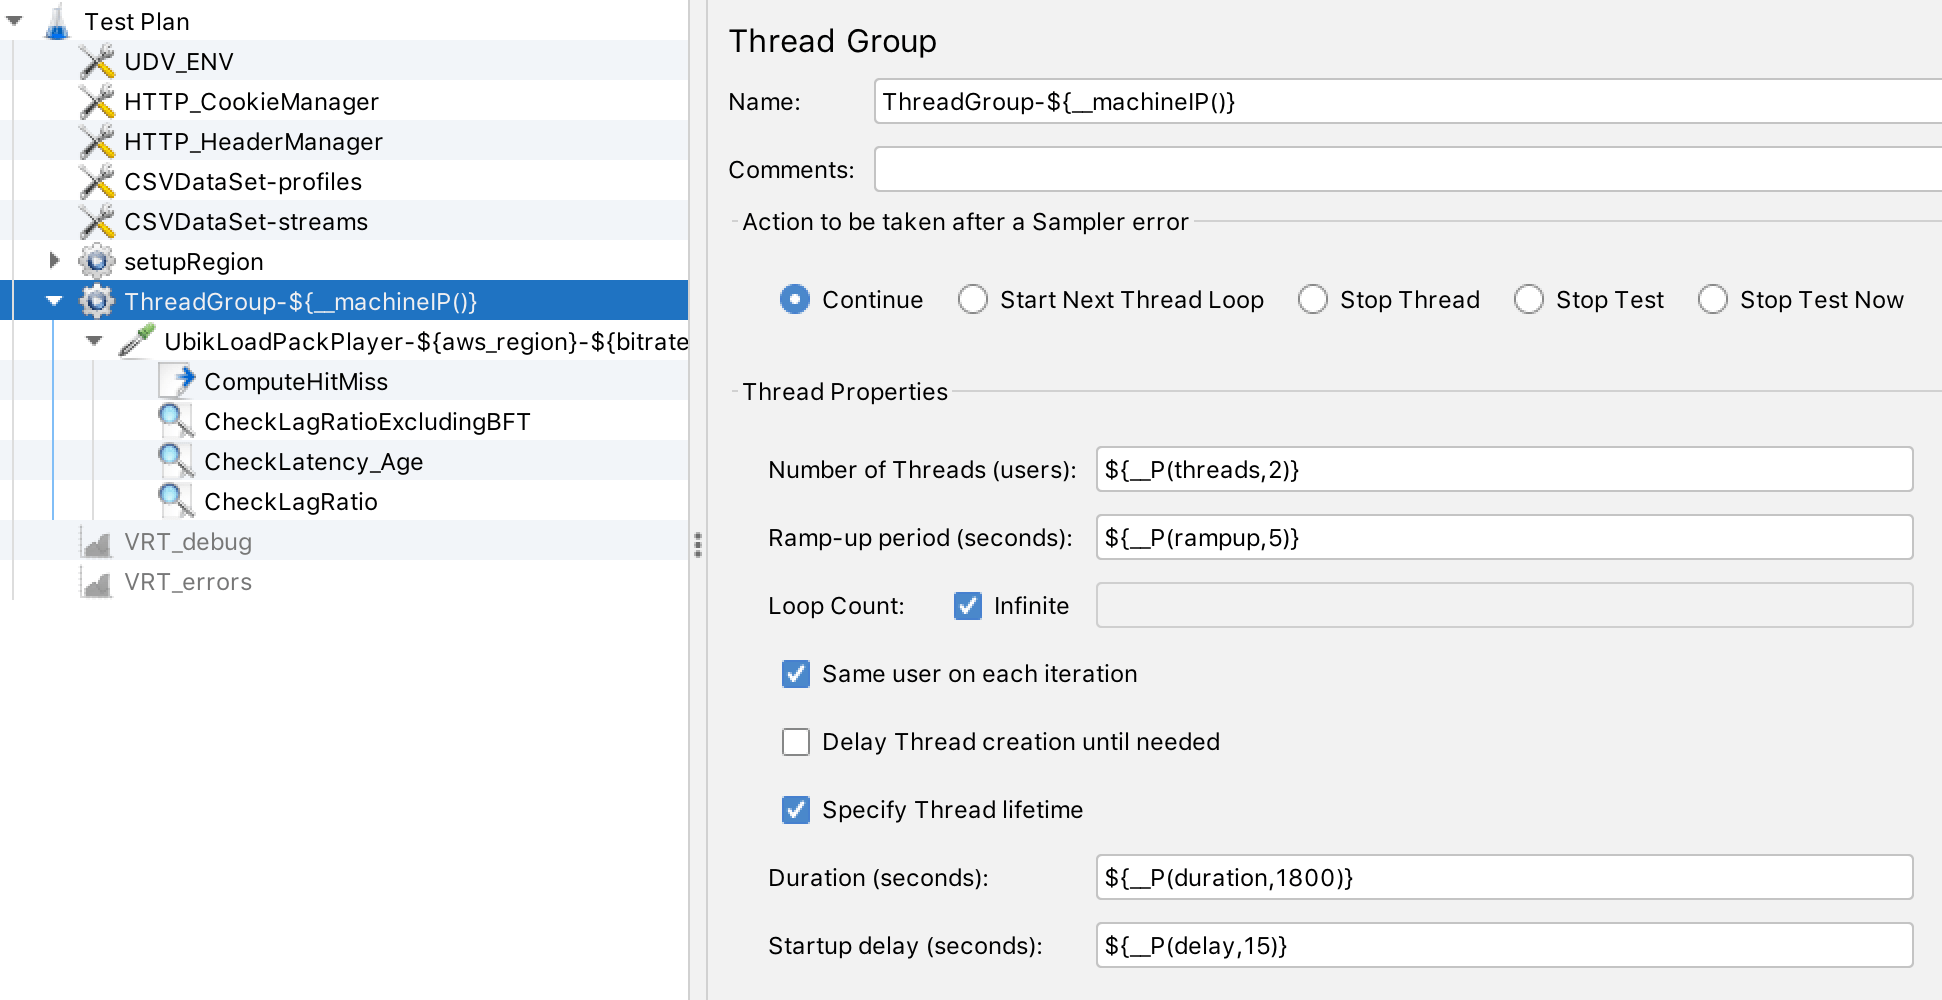
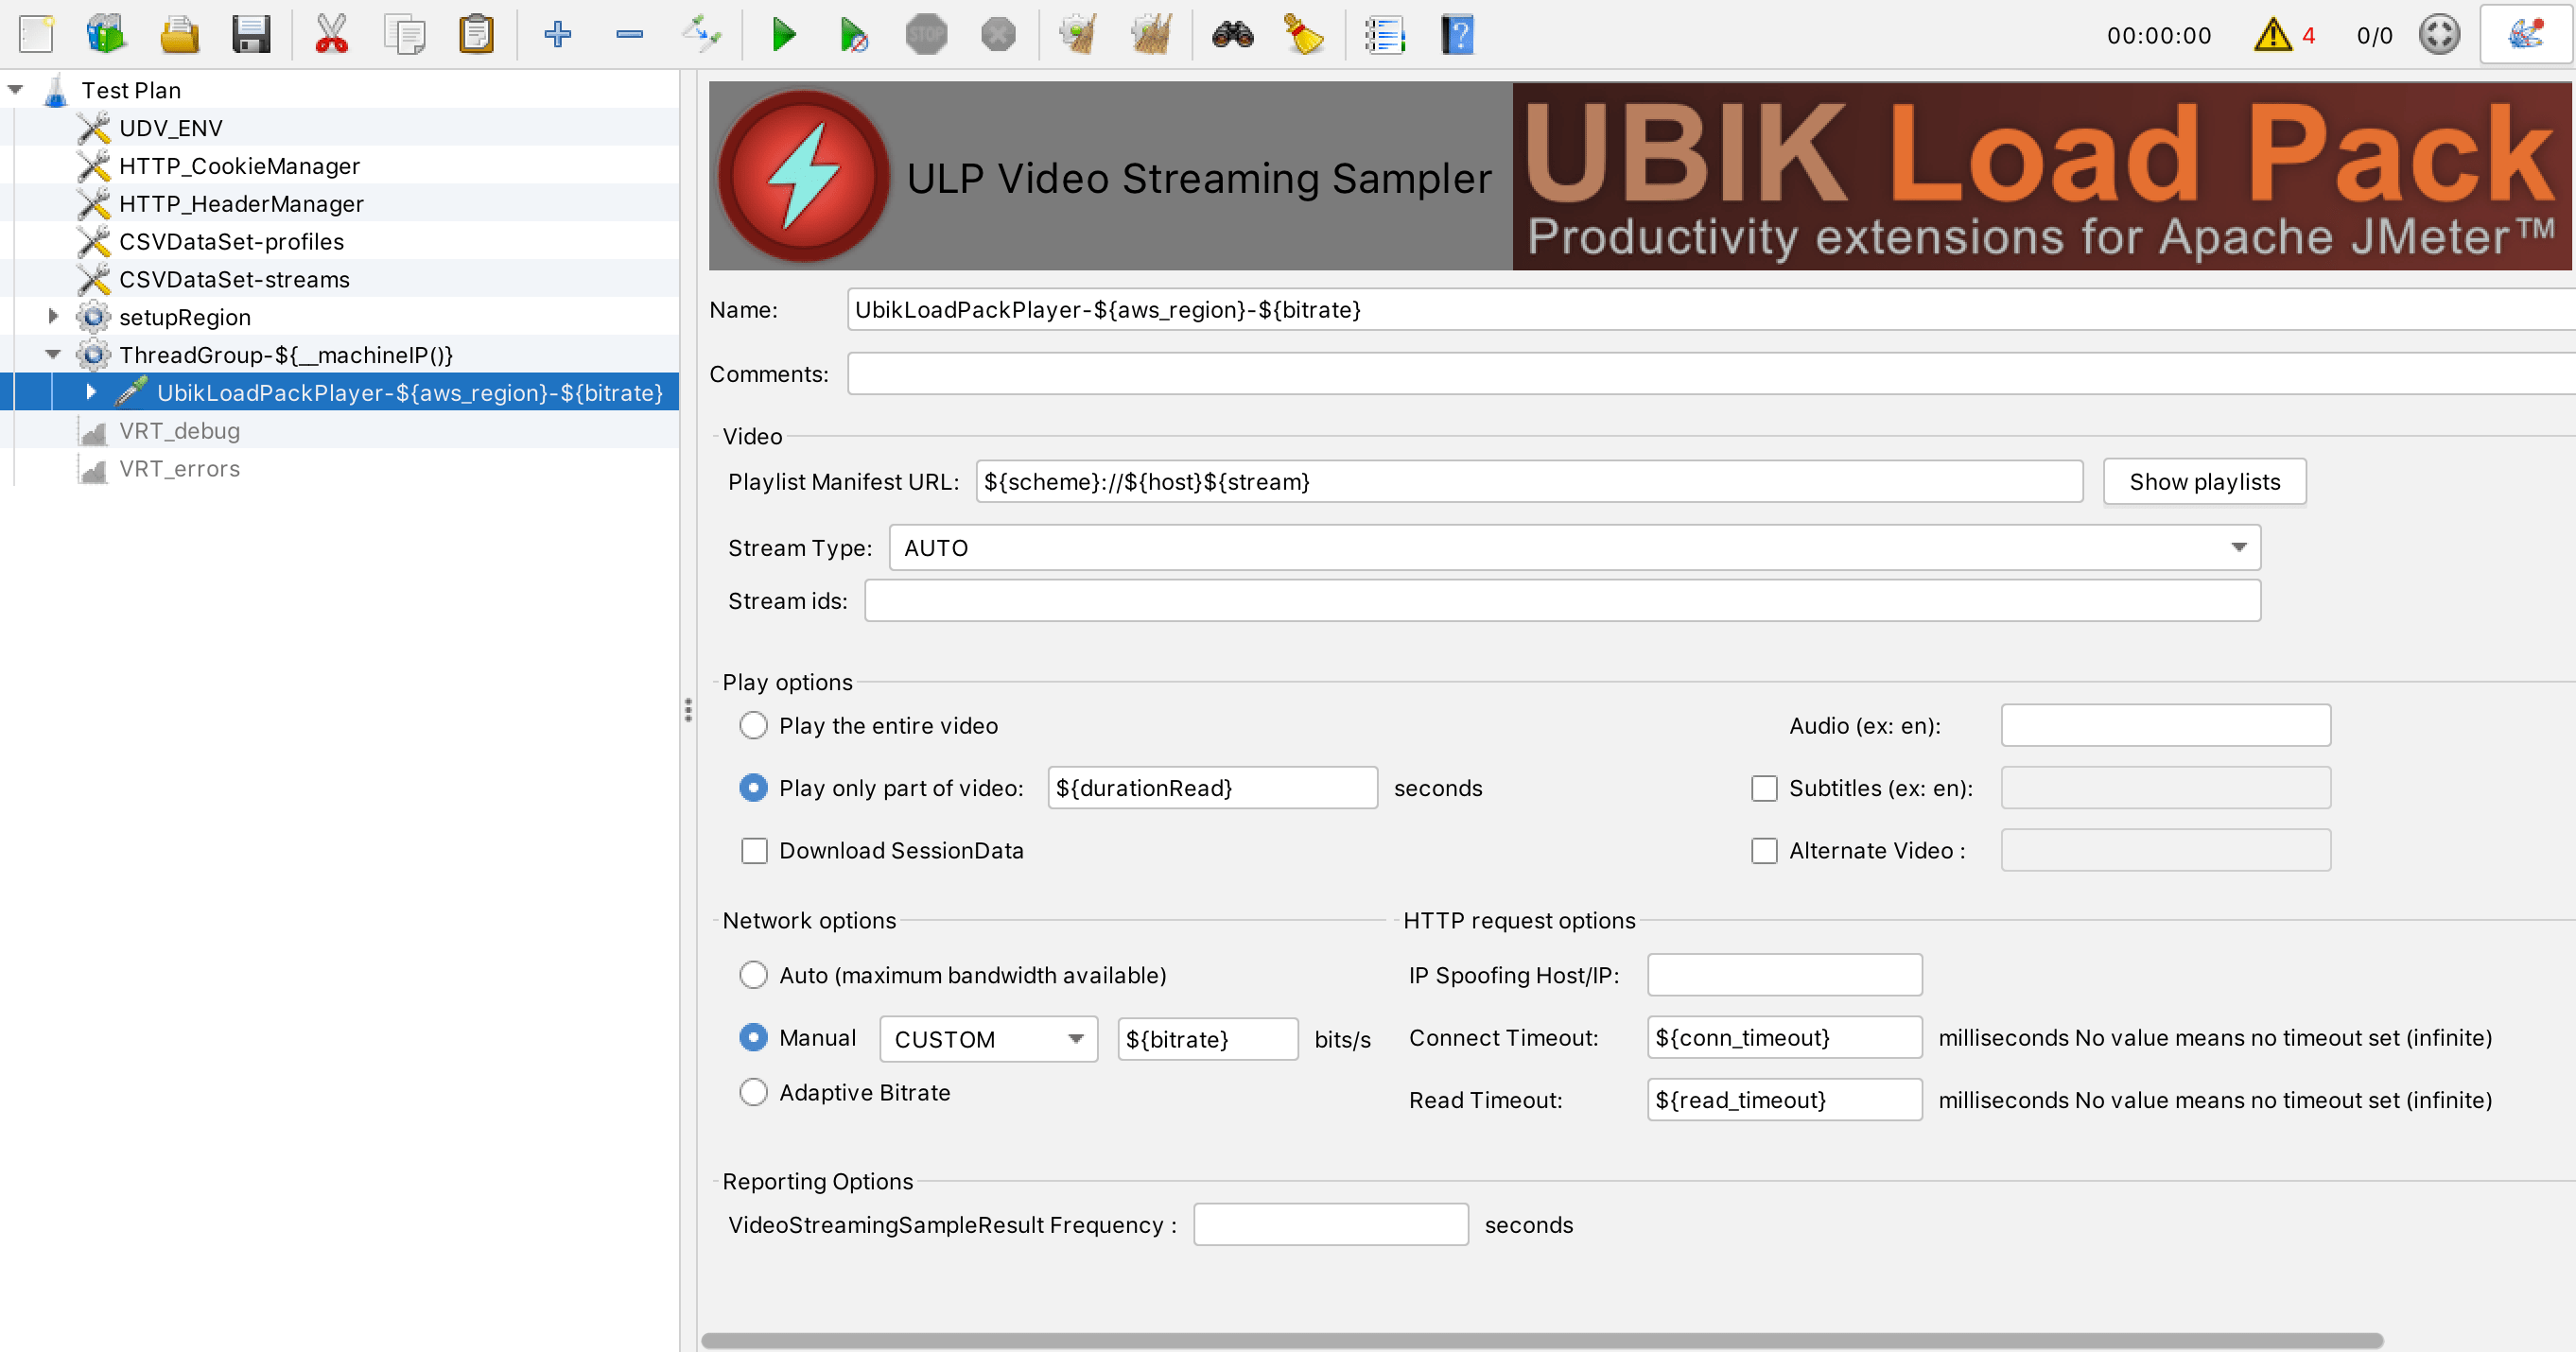
The JMeter Test plan is very simple:
We have a Thread Group where duration, threads, ramp-up and startup delay have been made variable, this will allow us to control them from the Web Interface of Redline13:
The Thread Group contains ULP Video Streaming Sampler which uses the stream and bitrate variables coming from CSVs and durationRead, conn_timeout and read_timeout defined in UDV_ENV (User Defined Variables):
And 2 CSV files to be able to vary Streams and Bitrates:
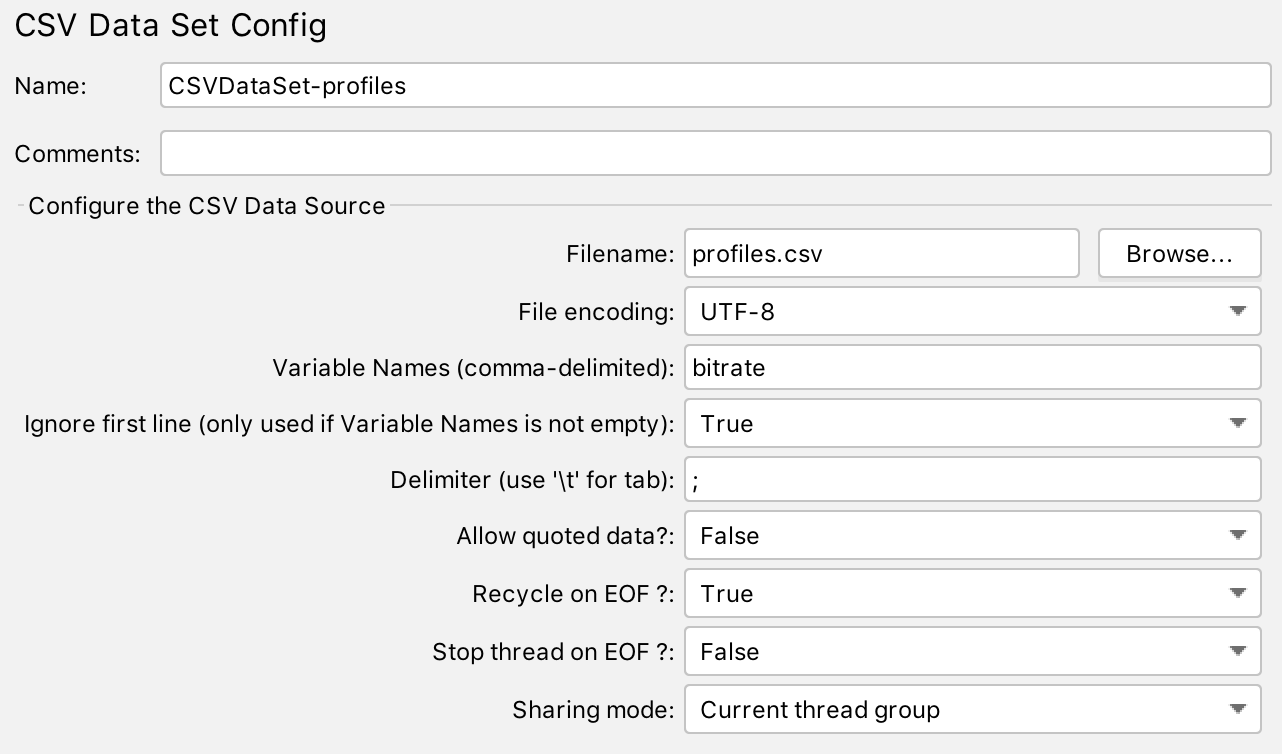
profiles.csv (loaded by JMeter CSV DataSet CSV-Profiles) contains the bitrates we want to test, this element will fill in ${bitrate} variable on each iteration of CSV with a different value
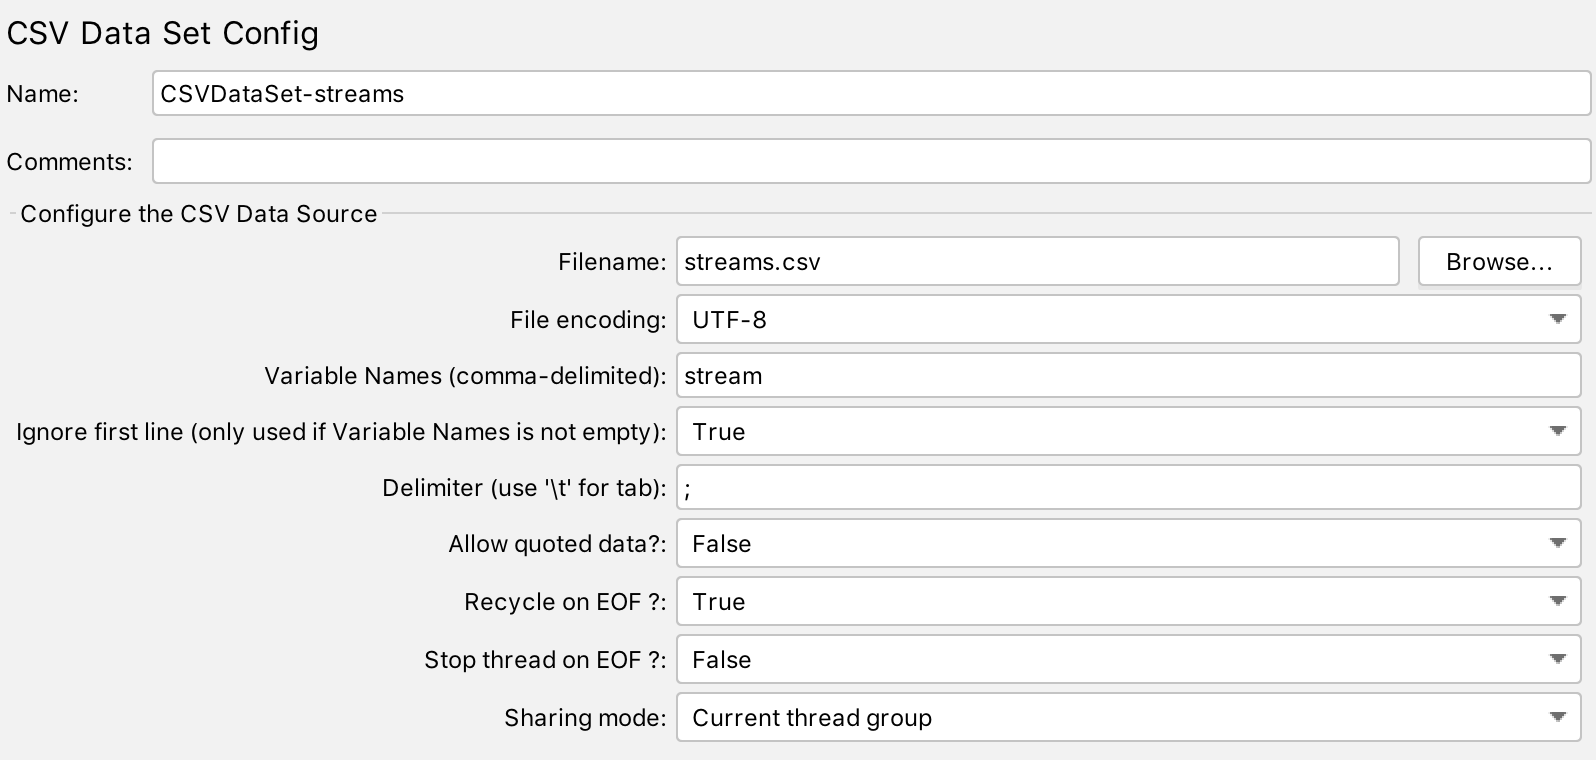
streams.csv (loaded by JMeter CSV DataSet CSV-streams) contains the streams URL suffixes we want to test, this element will fill in ${stream} variable on each iteration of CSV with a different value
In the above line , you may need to adjust parameters in bold depending on:
type of AWS instance and its memory (-Xms6g -Xmx6g)
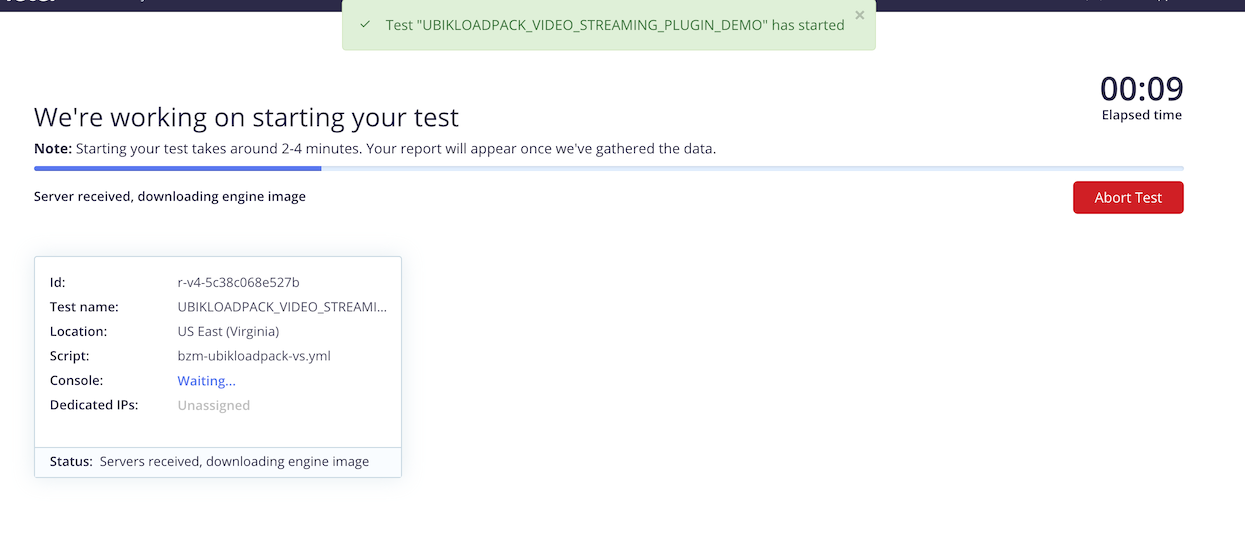
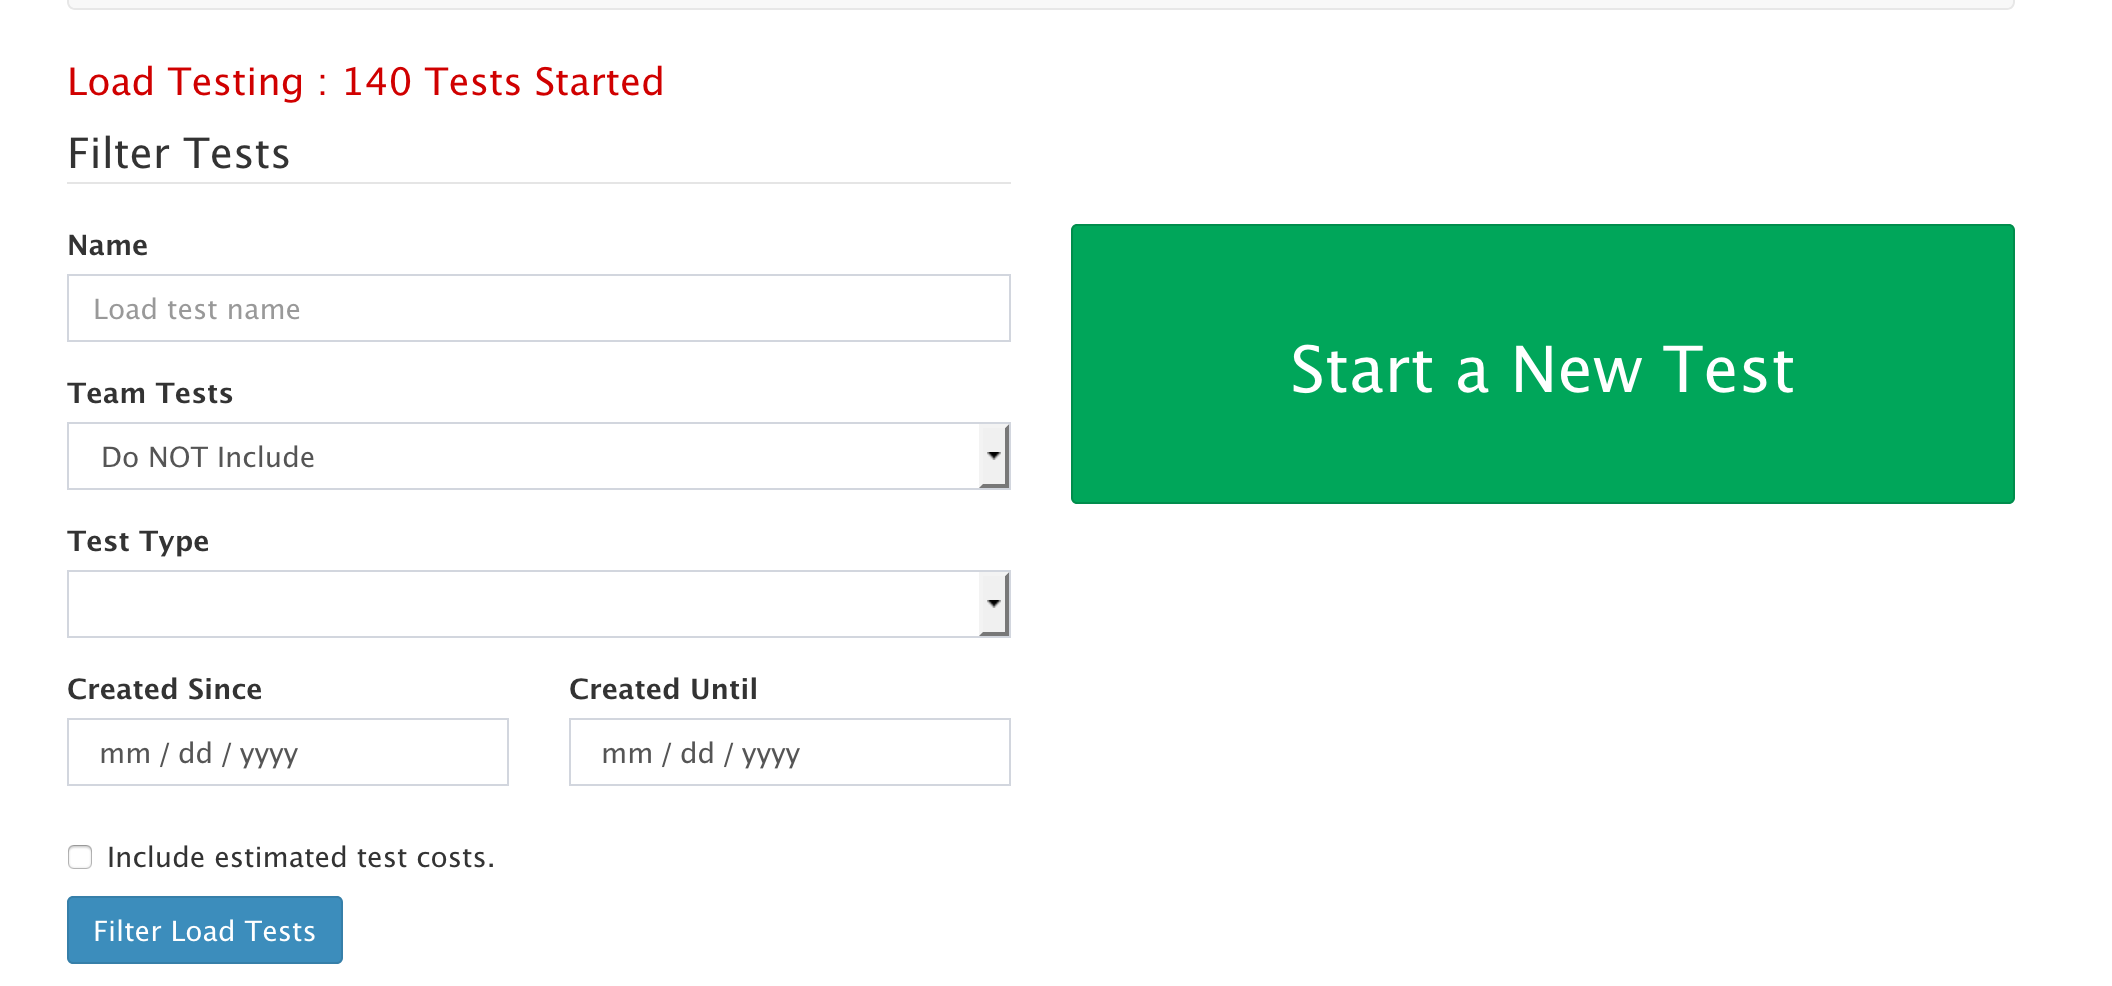
Give a name to your test and click Start !
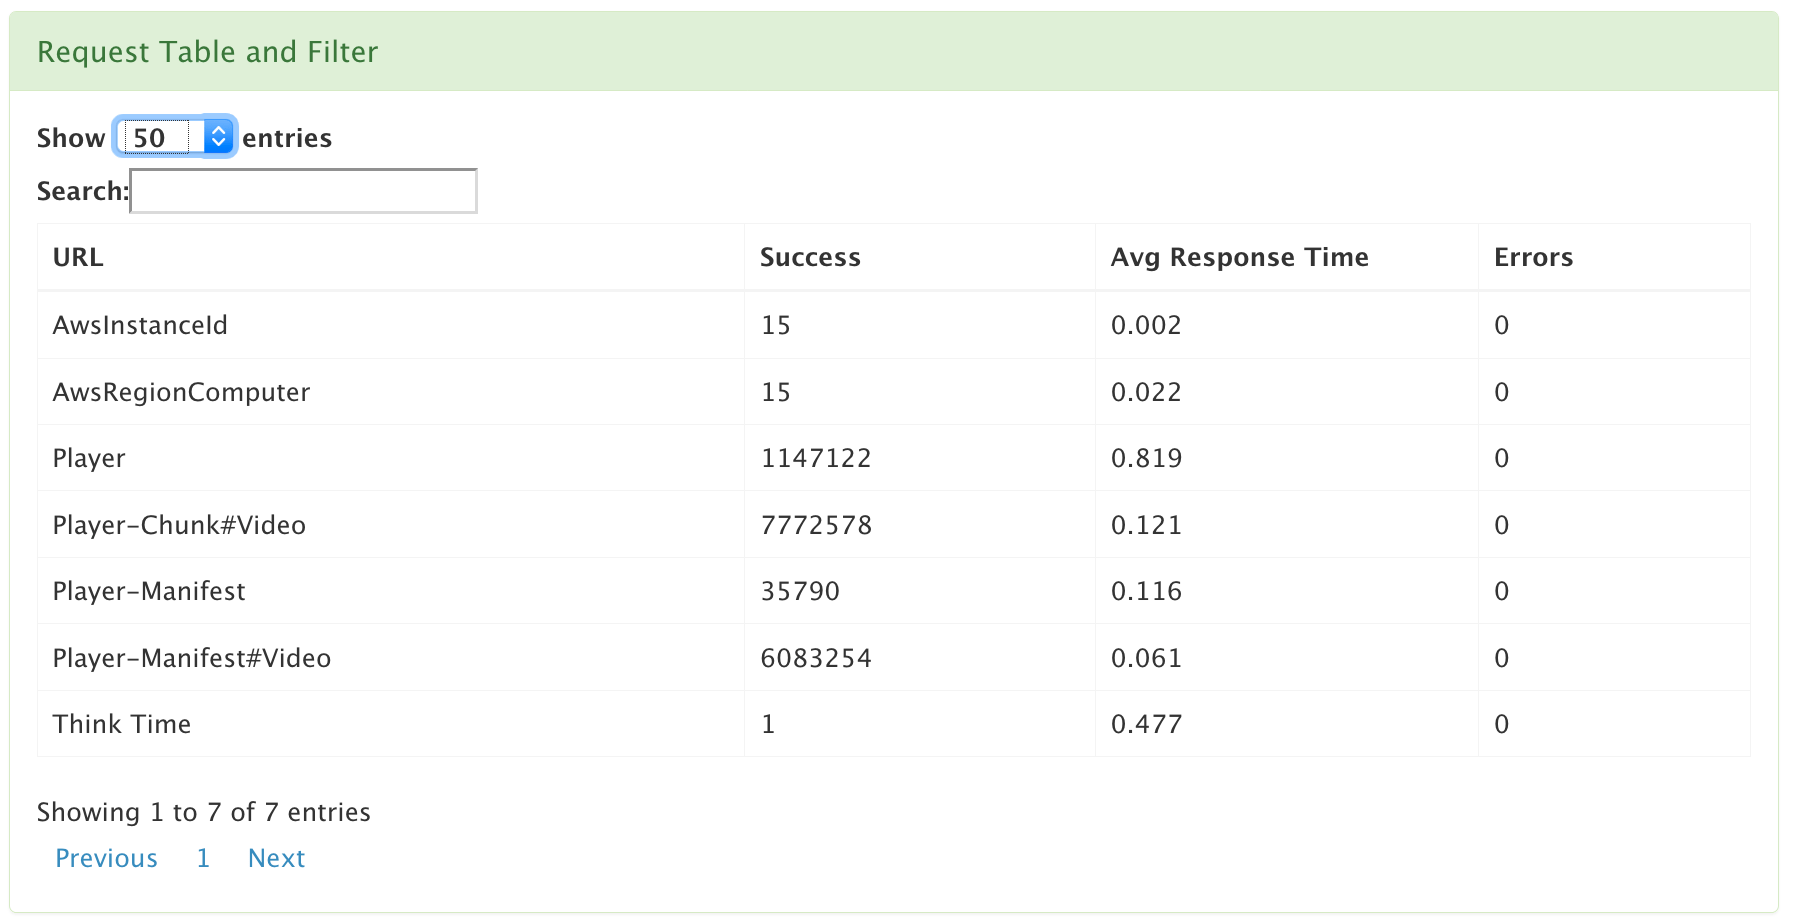
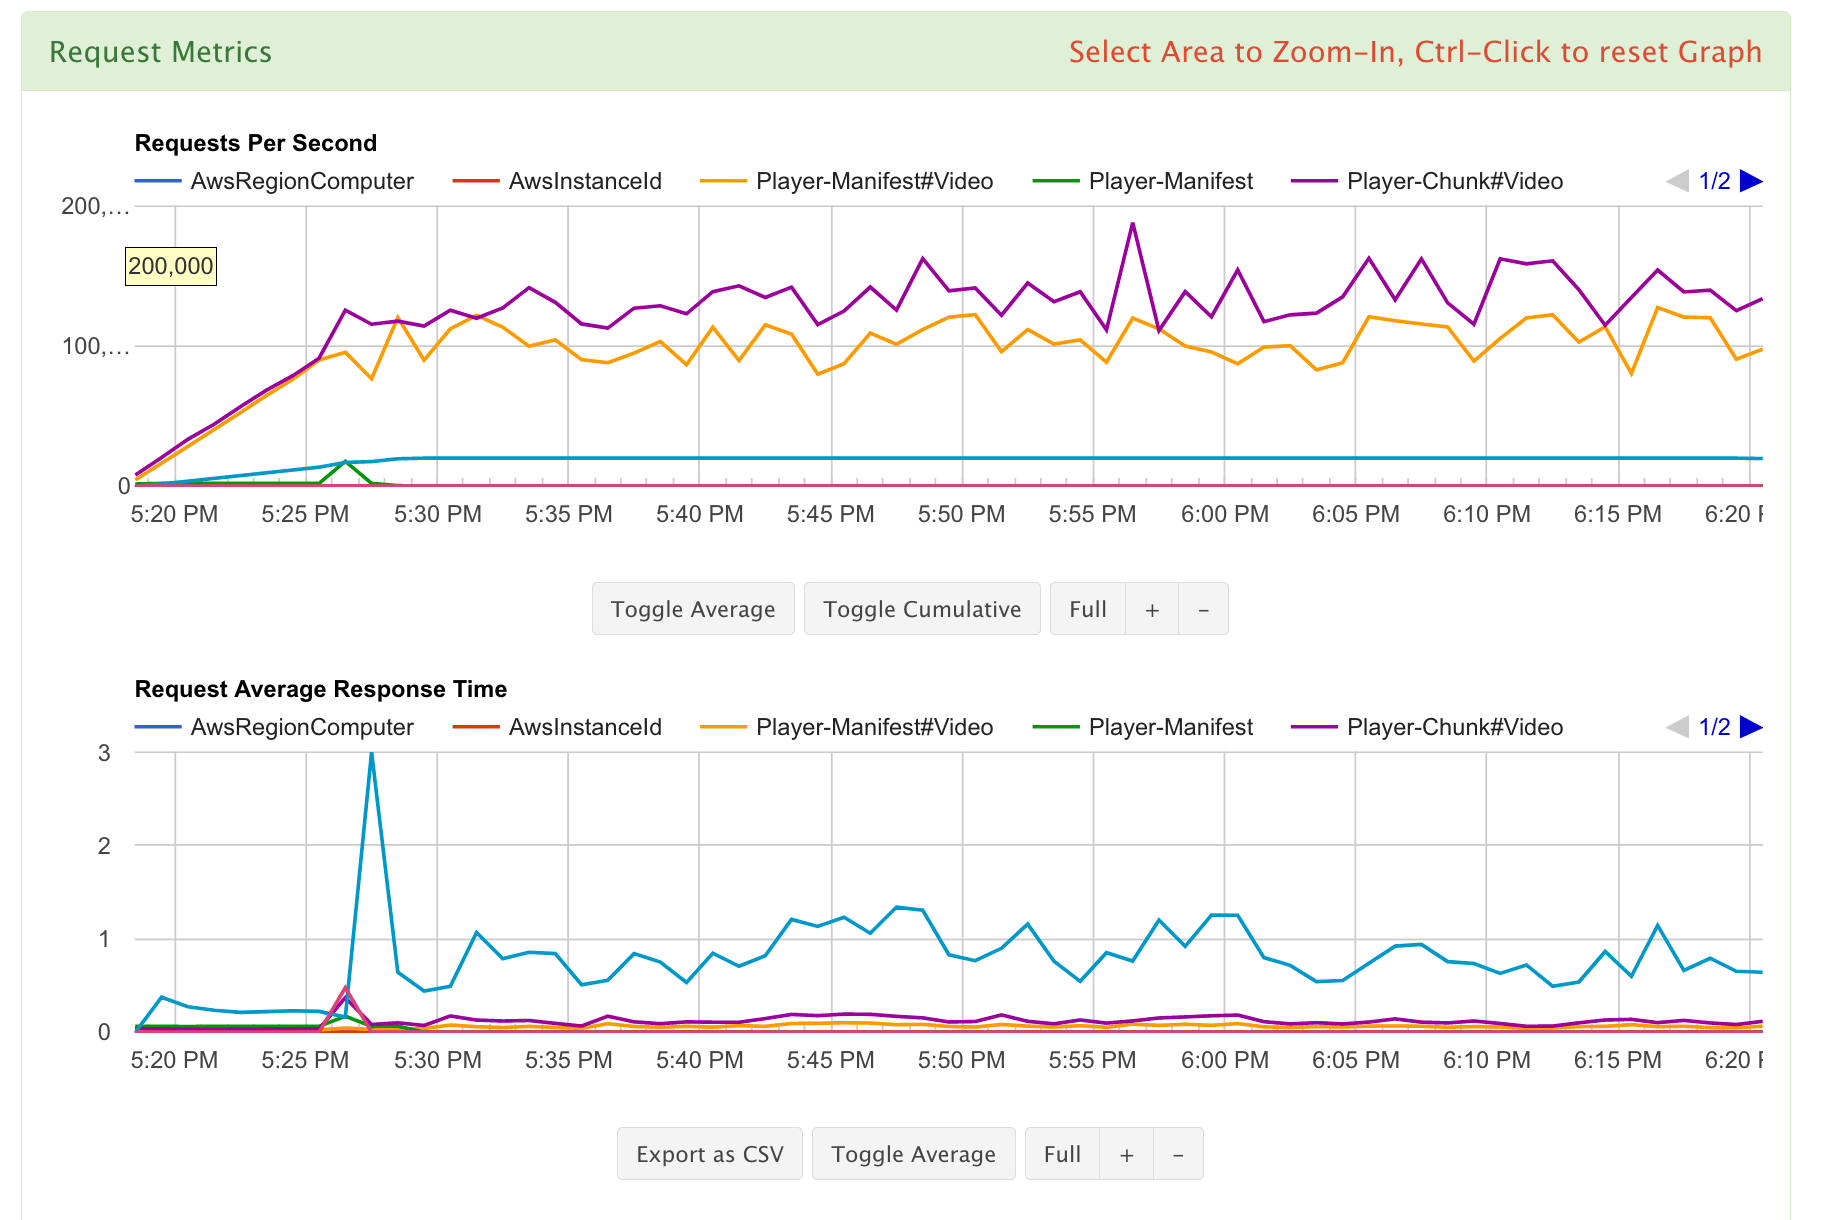
The test is now running, you can monitor it in the GUI and view while test is running:
Request metrics (Requests per second, KB Per request, Avg response time)
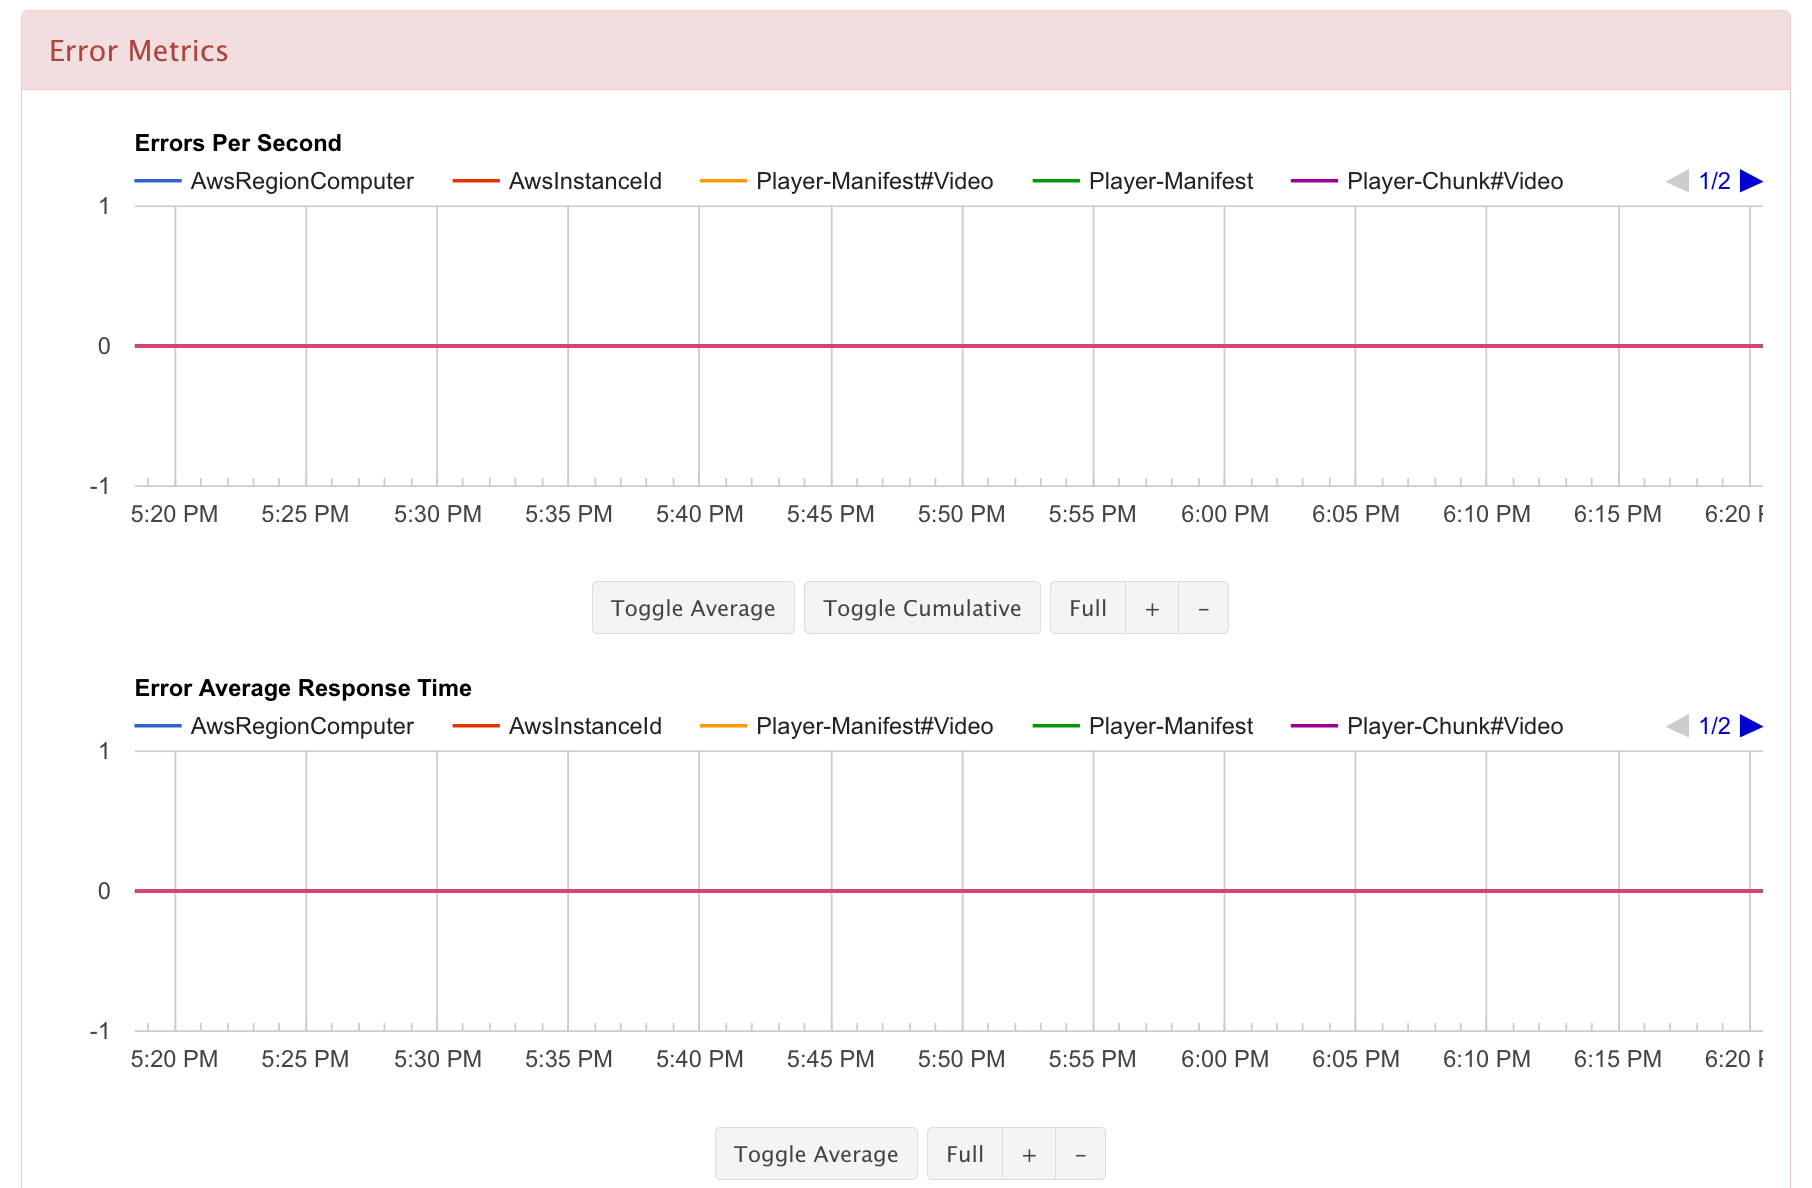
Error metrics(Errors per second, KB Per error, Error avg response time)
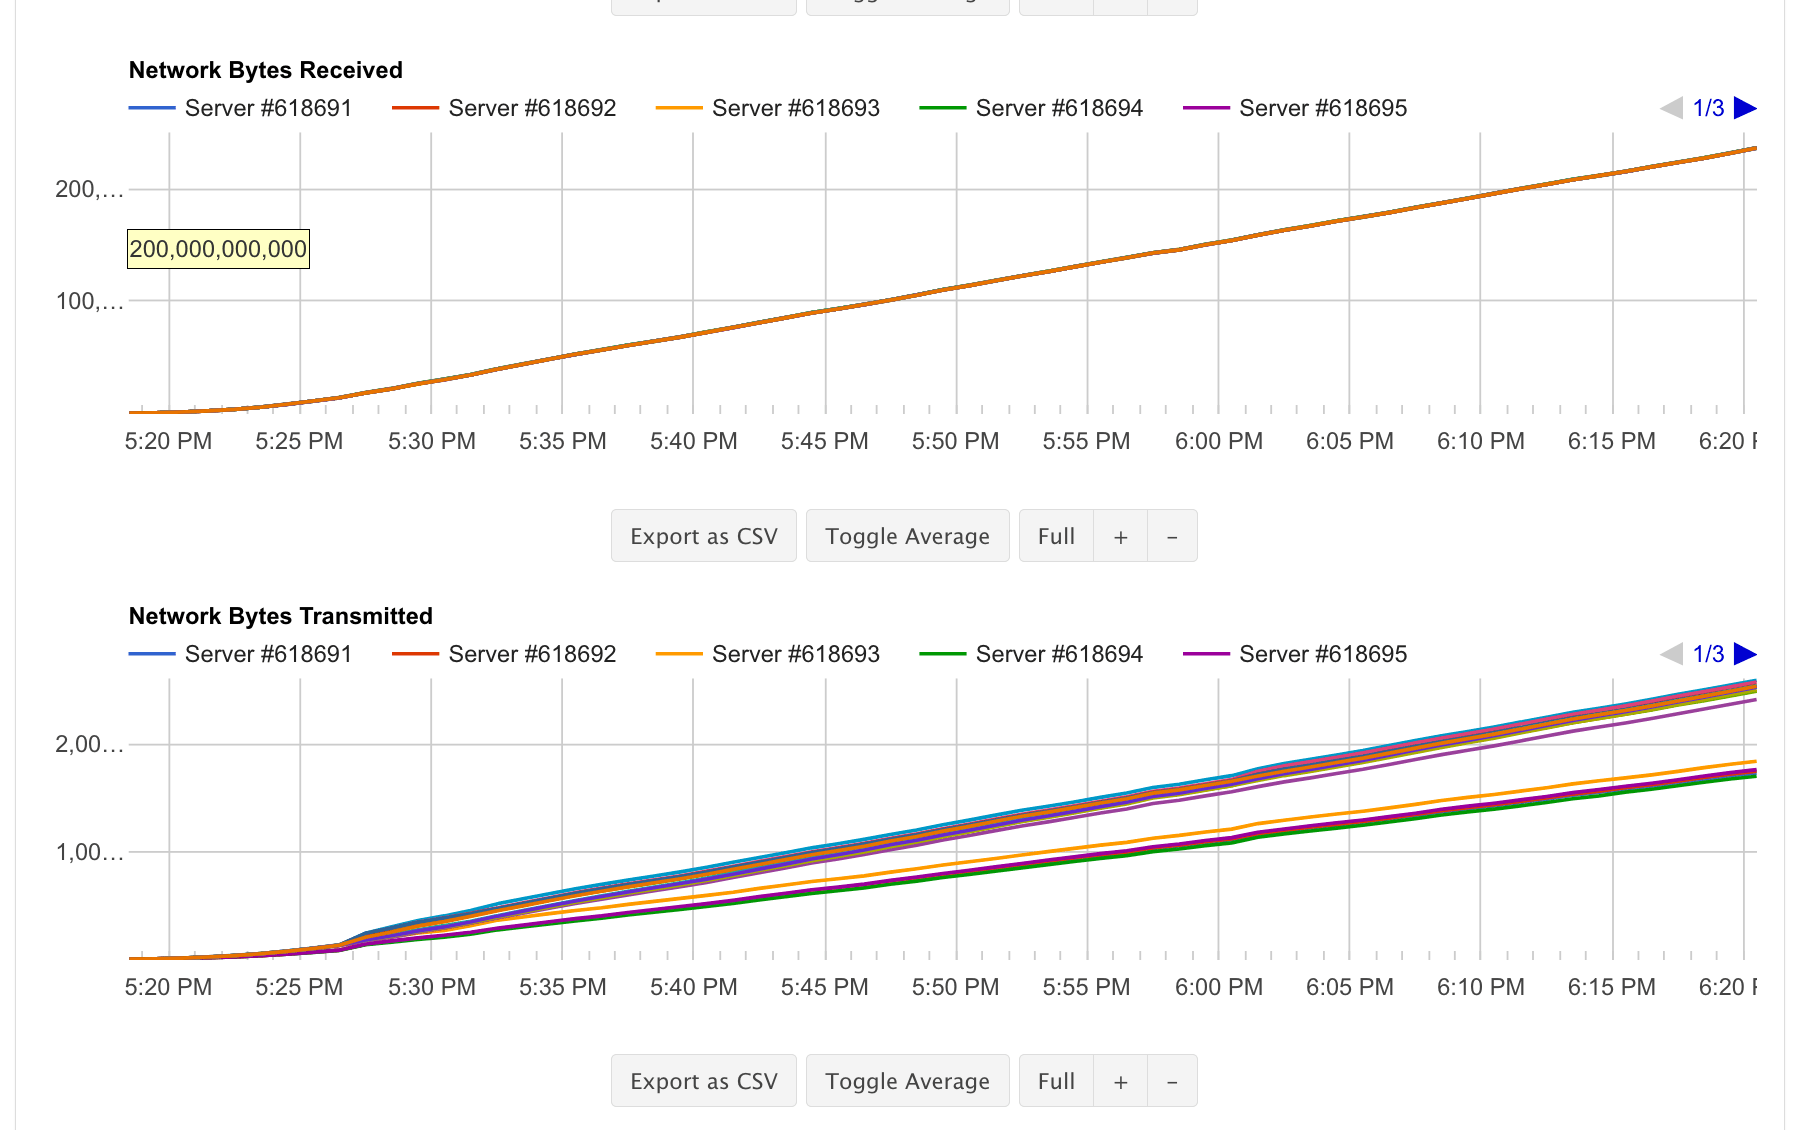
Agent metrics (CPU usage, Network In/Out)
The error table
Analyzing the test
Once your test is done, at the end of the test:
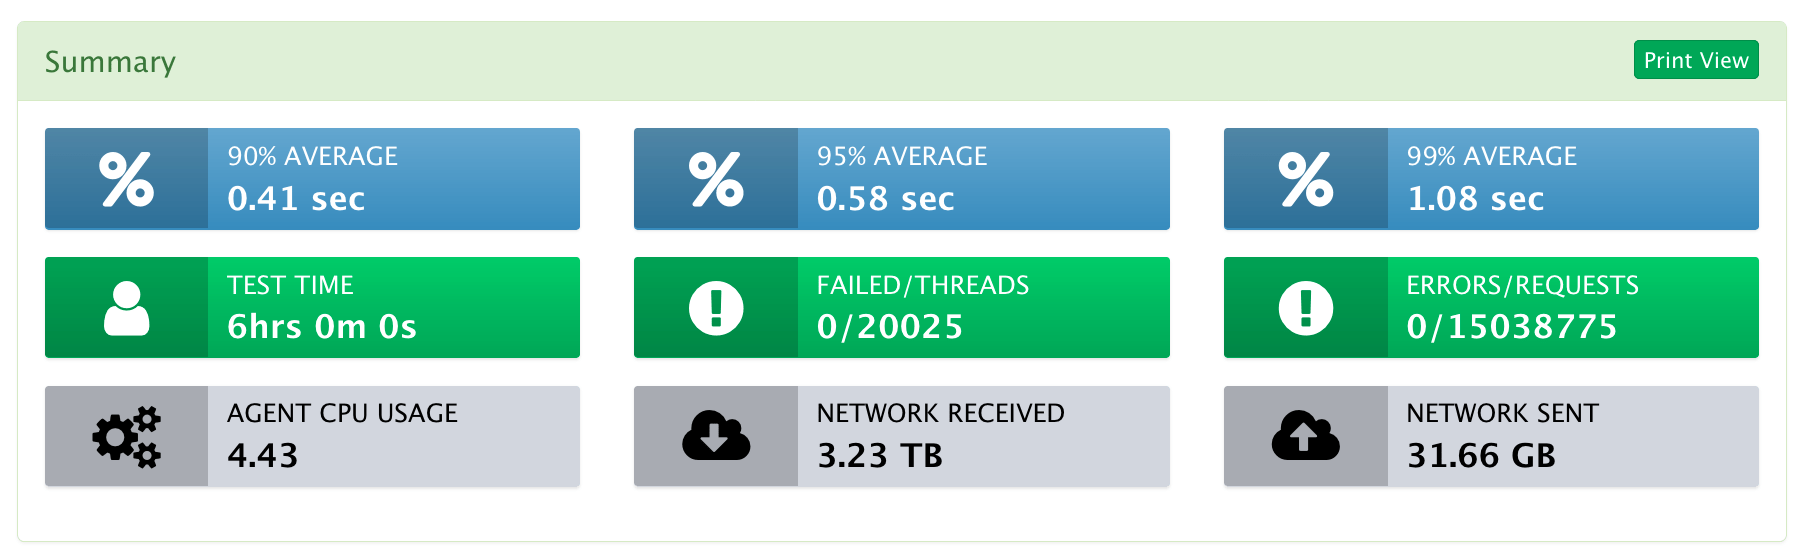
you get an overview of your test in Summary
you have the details of the run (JMeter and Cloud options)
you can add Notes and comments on your test
you can download jmeter logs from every server
More importantly:
you can download the HTML JMeter report generated accross all server . Note that this report will contain starting from version 5.0 of JMeter the custom graphs for :
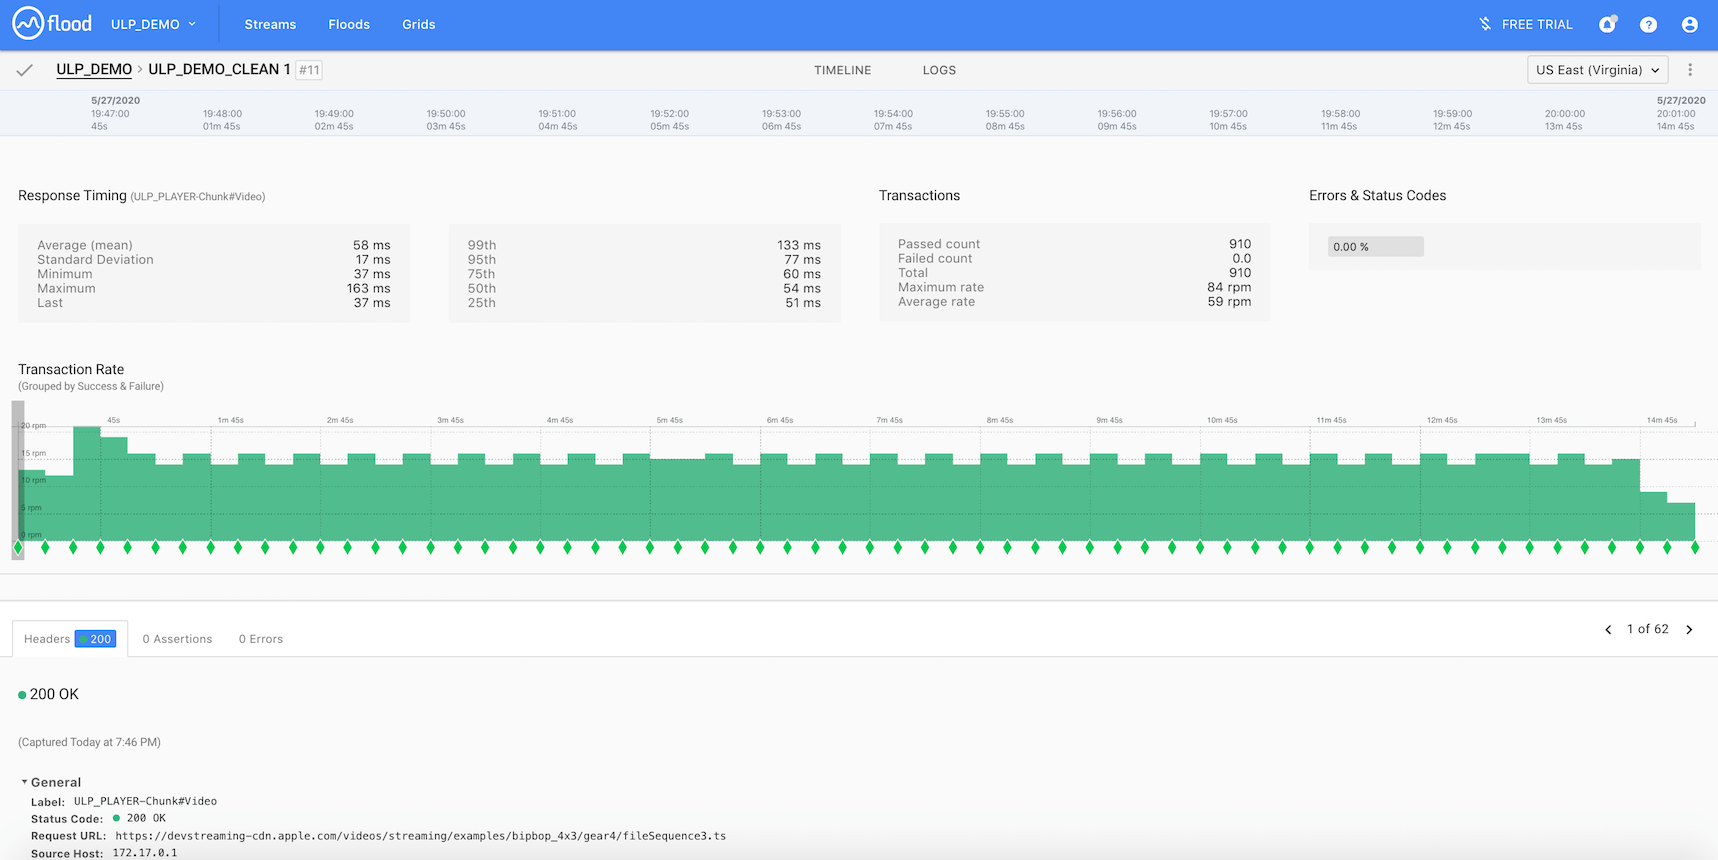
Statistics (response time in percentiles, error rate, network…) by type of request by type:
Manifest
Chunk
Subtitles
lag ratio graph
lag ratio without buffer fill graph
buffer fill graph
lag time graph
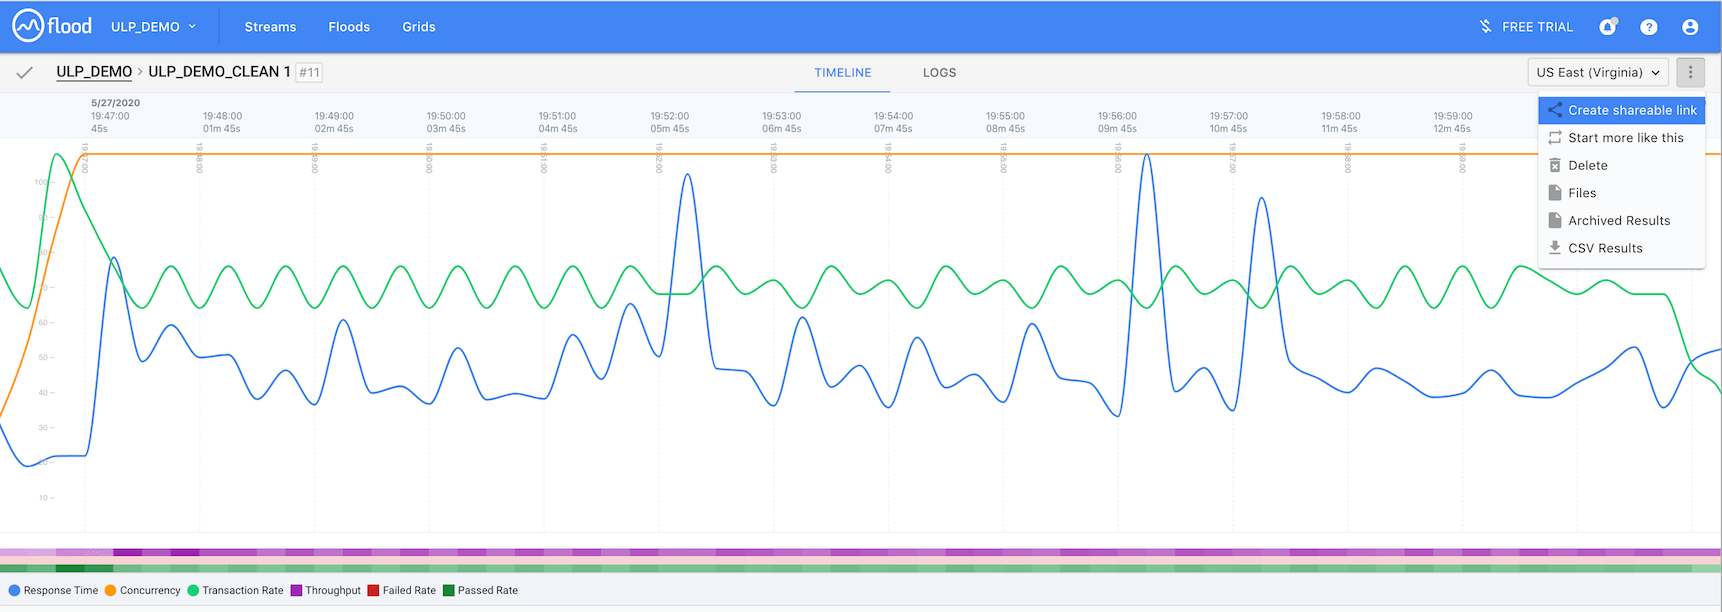
you can download the merged CSV accross all server that contains the custom metrics
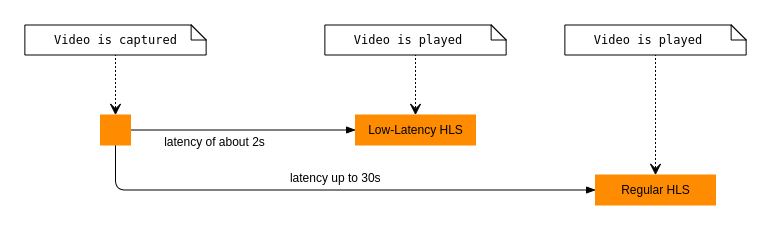
The latency is the time elapsed between capturing and playing the video. In other words, for live video, latency is a delay in comparison to real-time. Standard latency values are between 30s and 60s.
Thanks to Low-Latency HLS we can achieve a latency of 2 seconds or less.
Advantages of Low Latency
In LL-HLS, the aim is to have a latency of about two seconds. It is really close to real time. This is a necessity for many use cases.
Let’s say you are watching a sport or any other entertainment event, you do not want your neighbour to spoil the outcome, which will be the case with a higher latency.
Another example, if you are watching a video and there is a live chat, you need low latency, otherwise the reply might not make sense.
Low latency is also necessary for :
gambling
live auctions
betting
gaming
How to achieve Low Latency with LL-HLS
Low-Latency HLS introduces new tags.
Functionalities supported by server
First of all, the server will be able to indicate which low-latency features it supports:
EXT-X-SERVER-CONTROL is mandatory in Low-Latency. It allows the server to indicate which of LL-HLS functionalities it is compatible with.
CAN-BLOCK-RELOAD=YES means the server can block a playlist reload until a specified resource is available. It is mandatory in Low-Latency. The client specifies this resource with query parameters _HLS_msn and _HLS_part.
CAN-SKIP-UNTIL means that the server can skip a part of the playlist if it is requested by the client. It reduces the size of the playlist. This one is optional.
PART-HOLD-BACK is the minimum distance from the end of the playlist. A client can play a segment if it is at this distance. It is mandatory if the playlist contains partial segments, which is the case in low latency.
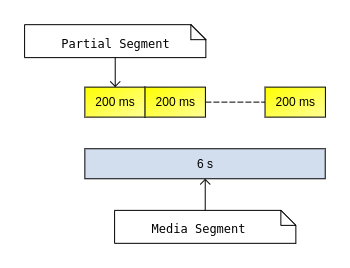
Partial segments
Next, in Low-Latency HLS, there are partial segments. Those are much shorter than regular media segments. Hence, they are added earlier in the playlist. The tags for partial segments are :
EXT-X-PART-INF gives info on partial segments. It is mandatory if any are present in the playlist.
EXT-X-PART identifies a partial segment
Preload
Moreover, the server can inform the client that a segment is available for request and soon for delivery. So, the client can request this segment earlier. The tag used by server is :
EXT-X-PRELOAD-HINT gives information about next available resource. The client can ask for this resource, and the server will provide it once it is available.
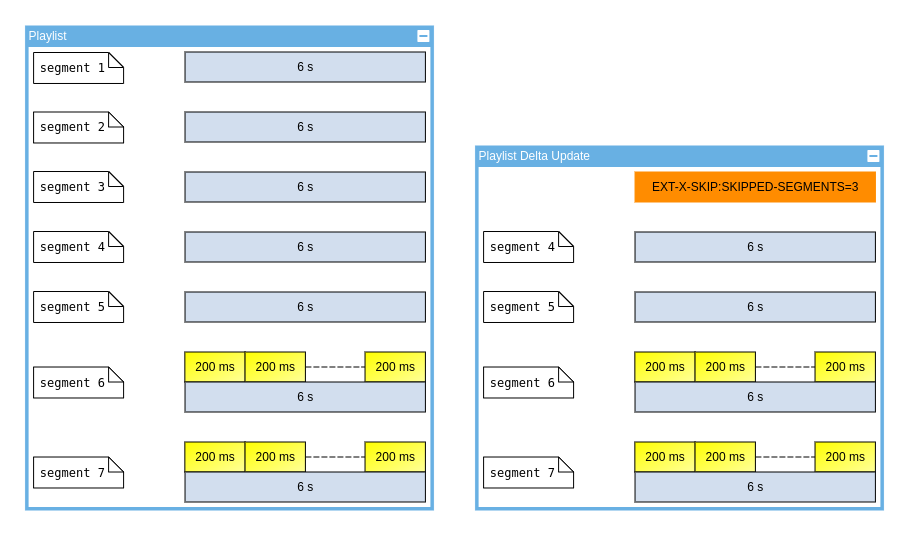
Delta update
Also, the client can ask for a playlist delta update. This allows to get only last part of the playlist. This can be used by the client if it already has the playlist and only wants to get new segments. The older segments are replaced by a new tag :
EXT-X-SKIP is there to replace ignored segments in case of delta updates. Only if client asked playlist delta update. In other words, reload playlist with query parameter _HLS_skip=YES
Other renditions
Finally, there is a new tag to switch renditions faster :
EXT-X-RENDITION-REPORT gives info about other renditions.
In this blog, we will give you a clear view of what are the features of UBIKLoadPack streaming solution.
You are:
an OTT service provider
a streaming infrastructure hoster
a software company delivering video streaming solutions
a media company delivering live event
You want to answer questions like:
How much simultaneous players can my infrastructure handle without problem ? (remember of the famous lag issues faced in Australia during last world football cup)
Are my customers facing lag ?
Is my live streaming delivered with an acceptable delay to my users ?
Should I upgrade my infrastructure for next live streaming event ?
UbikLoadPack video streaming plugin is the solution you’re looking for. We have been on the market since 2015 and are today a leader in performance testing Video Streaming servers delivering HLS, LL-HLS, DASH, LOW-LATENCY DASH, SMOOTH or HDS streams.
Let’s discover the current features of UBIKLoadPack streaming solution.
Playing simulation Features:
In the table below we present the features of the plugin related to realistic player simulation:
Preload (By default we support 404, 410 errors for Preload hint not published. There is a property “preload_hint_not_published_response_code” to support other error code)
Blocking Reload (Supports adjusting metrics using the blocking duration given by the server in a header. Use property “possible_header_names” to set the possible header names.)
HLS, DASH, SMOOTH, HDS
VOD/LIVE: Partial playing
Play a part expressed in seconds of the Video (Live, VOD)
HLS, DASH, SMOOTH
VOD: Resume playing from a point in time
Ability to continue reading a video where it was interrupted by an error. This simulates realistically how a user would interact with VOD.
HLS, DASH, SMOOTH
VOD: Start from an offset
Ability to start reading a VOD stream at a particular second. This simulates users who want to view a particular moment in a video.
HLS, DASH, SMOOTH
Live: Play close to live edge
This allows to simulate players which:
always follow live edge skipping part of the video (this can be useful for gambling for example)
go to live edge on start, then may be late on reading if servers/application start generating lag
HLS, DASH, SMOOTH
Audio track selection
This simulates a user selecting a particular audio language for a stream instead of the default one
HLS, DASH, SMOOTH
Subtitles track selection
This simulates a user selecting a particular language for subtitles
HLS
Alternate Video selection/playing
The player will download/play only the override media (audio or video). Adding alternate media to a primary playlist allows a provider to specify one of a set of variant playlists as an override of the main presentation.
HLS, DASH
Playlist filtering by Codec
This allows to simulate users with players supporting different set of codecs. Just fill the codec name, and matching playlist will be used
HLS, DASH
Byte-range support
The player simulator will emit byte-range requests for such streams
HLS, DASH, SMOOTH
Init segment support
The player simulator will handle Out Of The Box requests for Init segments
DASH
UTCTiming support
The player simulator will handle Out Of The Box and emit related HTTP requests if needed to compute the reference time for manifest which can be one of:
urn:mpeg:dash:utc:http-xsdate:2014
urn:mpeg:dash:utc:http-iso:2014
urn:mpeg:dash:utc:http-ntp:2014
urn:mpeg:dash:utc:ntp:2014
urn:mpeg:dash:utc:http-head:2014
urn:mpeg:dash:utc:direct:2014
HLS
Session Data Download
This feature allows downloading the JSON file containing session data if not inlined in manifest
Ability to parameterize values:
When doing testing or performance testing, it is critical to have a wide range of data to avoid cache effect and too optimistic results.
To make tests portable across environments, it is also important to be able to variabilize any environment specific value.
Hopefully, the plugin is integrated with JMeter and follows same approach to parameterize any value.
In order to parameterize, you can use:
Variables:
Every Virtual User has its own set of values that can be loaded from a CSV (using CSV DataSet), there are suitable for things like:
Parameterizing is also possible through properties. Properties are shared across all threads (aka Virtual Users). They are kind of global variables suitable for things like:
In this paragraph, you ‘ll see that UbikLoadPack streaming solution plugin allows you to customize network configuration for test.
Bandwidth selection
Based on network bandwidth the plugin will automatically select the corresponding playlist allowing you to simulate different levels of customer bandwidth and having metrics on their user experience.
IP Spoofing
This feature of UbikLoadPack solution allows you to use multiple network interfaces of the machine performing the test.
This is useful when you have a powerful machine that is able to simulate thousand of Virtual Users and you want to check that an IP Based load balancer in your architecture is correctly doing its job.
It is also useful when each network interface is limited in terms of bandwidth, you can then use it to perform tests reaching up to “Number of Network Interface * Bandwidth limit of Network Interface”
Timeouts
UbikLoadPack allows you to adjust several network options of your test:
Connect timeout of each HTTP request, if the HTTP connected takes more than the configured timeout to be established, the request will be marked as Failing in timeout
Read timeout of each HTTP request, if the HTTP response takes more than the configured timeout to arrive, the request will be marked as Failing in timeout
Reporting features:
HTTP requests related metrics:
The plugin will also provide following metrics for each HTTP request:
Response time
Response Status
Response message
Error rate
Sent/received bytes
Each request will be suffixed by its type:
Audio/Video Chunk
Audio/Video Manifest
Subtitles
Audio/Video Init Segment
SessionData
Video Streaming UX related metrics
Besides it will provide Video related metrics giving precious information on User Experience:
Lag time
Buffer fill
Lag ratio with buffer fill
Lag ratio without buffer fill
Speed Rate for Dash (as specified by Low Latency Dash)
Offset to Live Edge (number of segments behind live giving information on potential delay to live edge)
Integration with JMeter:
Moreover, the plugin integrates smoothly with Apache JMeter. Apache JMeter is the famous and leading solution for performance tests. So this allows you to use all features of JMeter. For example by adding authentication before accessing video.
How to ensure the best quality of viewing experience during the live transmission of an enterprise communication event ?
By Performance Testing video streaming services with UbikLoadPack
Recently, one of our client wanted to verify that his new conferencing infrastructure could properly handle the delivery of a communication and training event for its 4,000 healthcare workers.
Websocket system to allow watchers to ask questions
He wanted to check multiple things:
Customers user experience (no lags, accuracy of stream, no delay)
Ant media delivery performance
Bandwidth of the network
Performance Test his video streaming servers up to 4 000 players
His event was a national one, where healthcare workers would be watching Covid19 related event from Switzerland (Europe).
So he contacted our professional services for a turnkey service of a realistic performance test on a HLS live stream in order to validate or improve its streaming infrastructure before the fast coming event.
Which tools to use and why ?
His OTT service was composed of an origin delivering Live HLS manifests using AntMedia solution.
Since we needed to run a Performance Test for a on premise HLS Live stream, we used:
UbikLoadPack Video Streaming plugin fits customer requirements in the following fields:
Reproduce realistically and very easily a player reading Live stream delivered in HLS in this particular case (MPEG-DASH, MS Smooth are also supported). There is no need to write complex and unmaintainable JMeter test plan to reproduce the player behaviour, knowing that the multitude of formats and possibilities of Live Streaming makes this very complex and time consuming.
Provide custom metricsto analyze User watching video experience
Ability to graph those metrics
Availability from the Cloud. For the short term, customer wanted to run the test from the Cloud
Redline13 fits customer requirements in the following fields:
Easily deploy JMeter + UbikLoadPack with a single click from a web page on multiple servers in the AWS Cloud
Start those servers from all over the world using AWS datacenters from a simple Web Page
Live feedback on performance test
Merged results and metrics in one CSV accross all nodes
Get the JMeter report auto generated at end of test
3. Delete from jmeter/lib folder the following jars:
log4j-1.2-api-2.13.3.jar
log4j-api-2.13.3.jar
log4j-core-2.13.3.jar
log4j-slf4j-impl-2.13.3.jar
4. And replace them with the new version jars
You’re done !
The long term solution
Remember that many of those OSS free solutions are frequently developed by people working on their personal time, so if you use their software, you can help them in many ways:
Say thanks
Report bugs
Report security patches
Contribute:
to their documentation, their forums
through personal donations to the developers when they offer this option
through donations to their foundations
Sponsor their work
And finally, KUDOS to the Log4J2 Team and JMeter teams which were very reactive fixing the reported issues.
Following the request of one of our users, we would like to share with you the procedure to update JMeter plugins from the command line interface (CLI) in a continuous integration and delivery pipelines.
The context
When deploying JMeter within a CI/CD pipeline you want to:
Install a plugin automatically
Update the plugin automatically to the latest version
In this blog we’ll see how JMeter-Plugins-Manager can help updating plugins using CLI in CI/CD pipelines.
Make sure cmdrunner-X.Y.Z.jar is present in jmeter/lib directory
If not, take it from here, the latest version is 2.3 at the time of the writing (https://repo1.maven.org/maven2/kg/apc/cmdrunner/2.3/cmdrunner-2.3.jar)
Start JMeter then quit, this will install additional files, make sure PluginsManagerCMD.sh or PluginsManagerCMD.bat is present in jmeter/bin directory
If not, from jmeter/bin folder, run below command to have the files created:
The solution to update JMeter Plugins using CLI in CI/CD pipelines
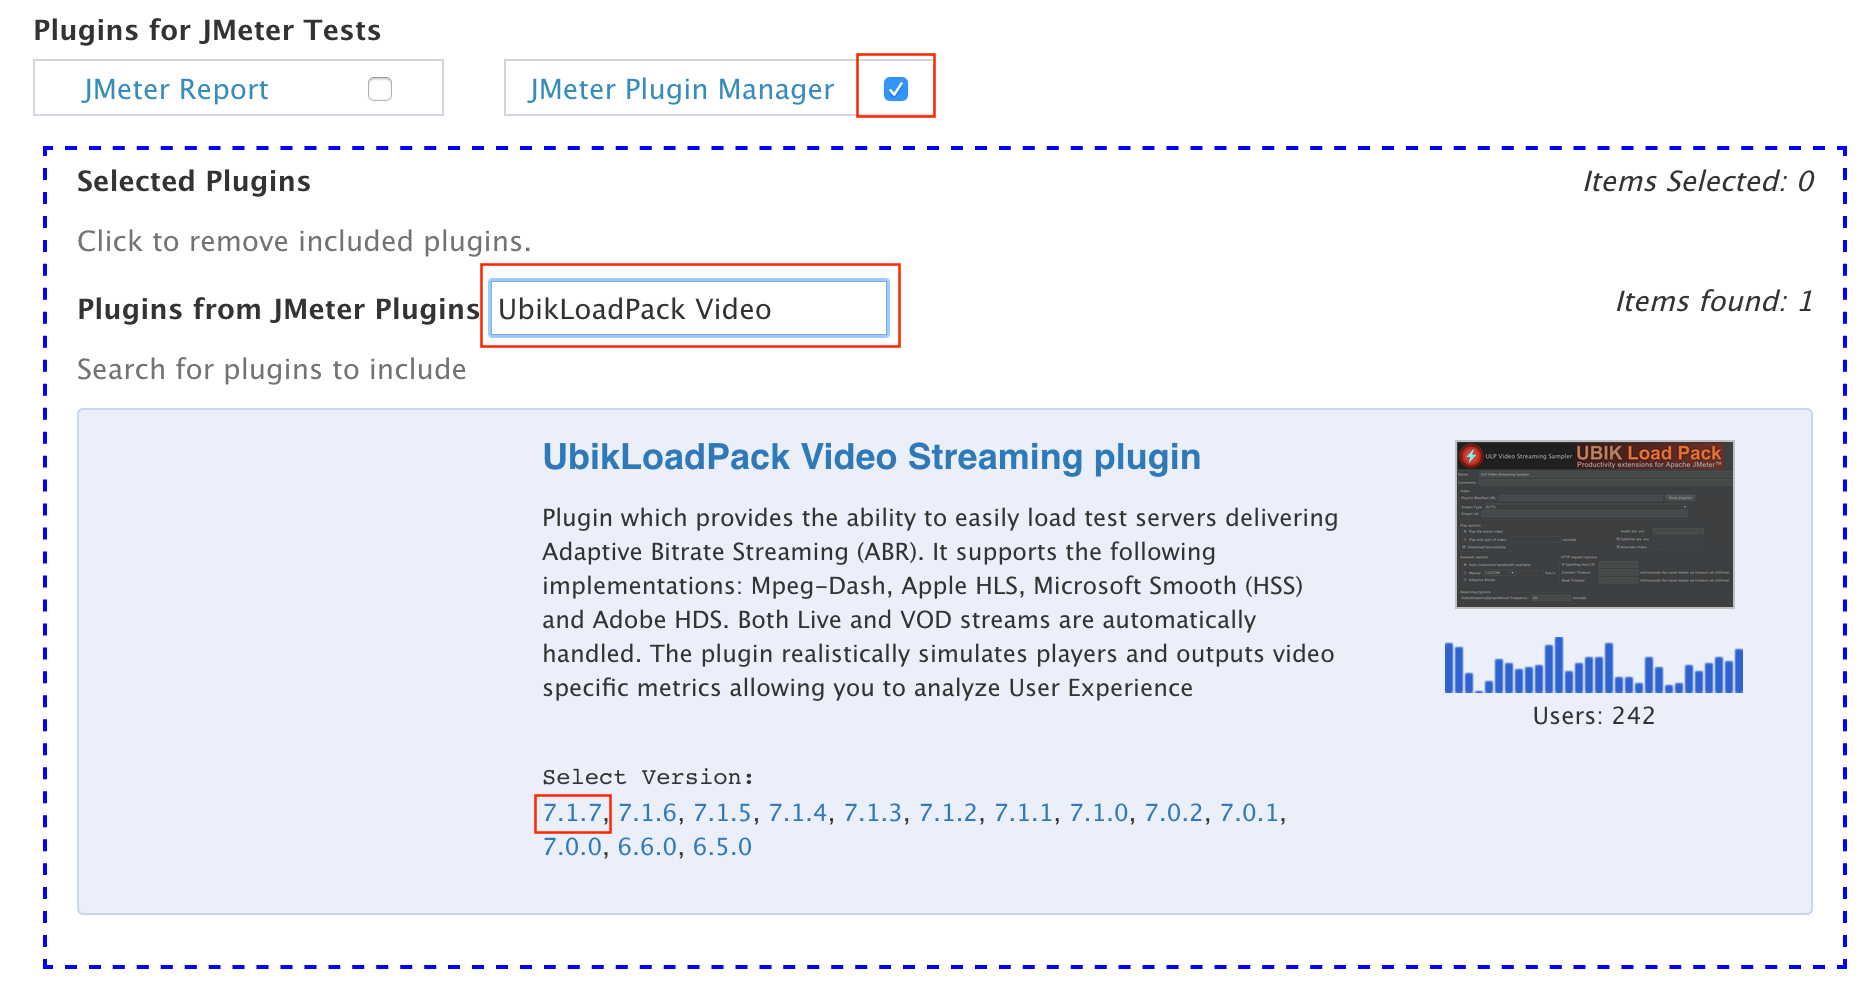
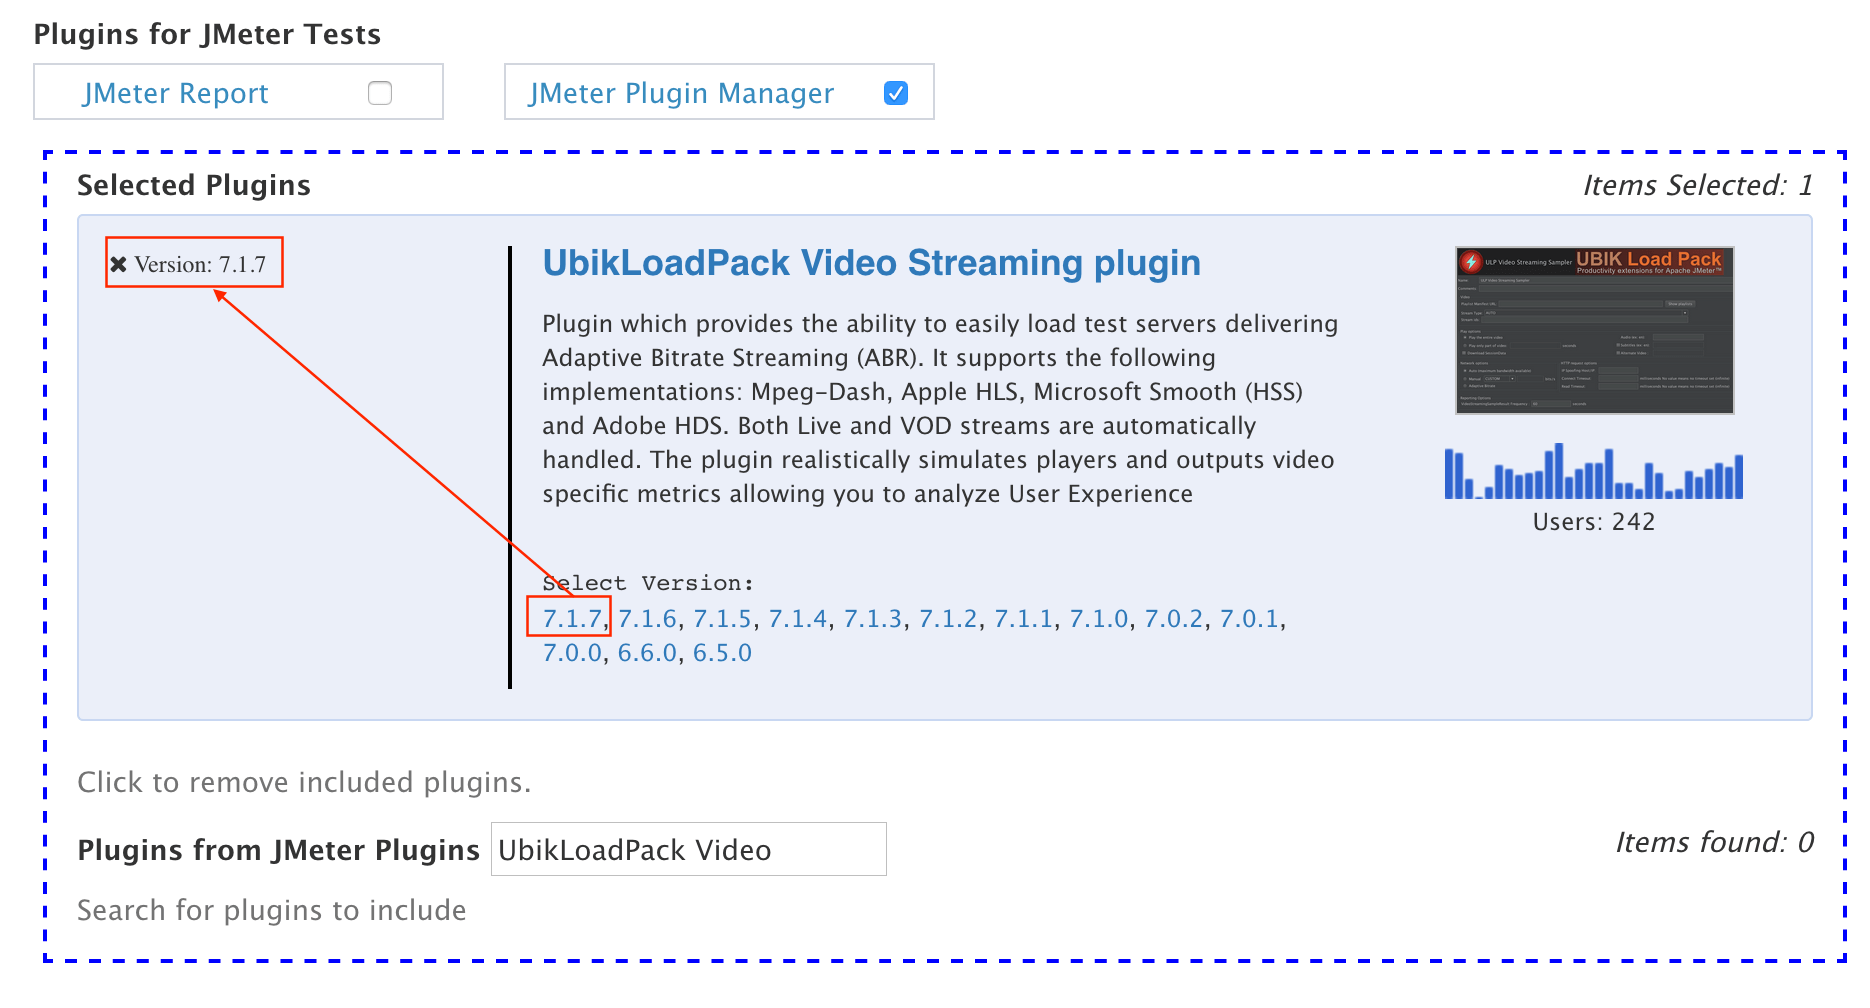
Now we have the setup done, we will test using UbikLoadPack Video Streaming plugin, but you can do it with any JMeter-Plugin that is published at https://jmeter-plugins.org.
How to ensure the best quality of viewing experience during the live transmission of a football event ?
By Performance Testing video streaming services with UbikLoadPack
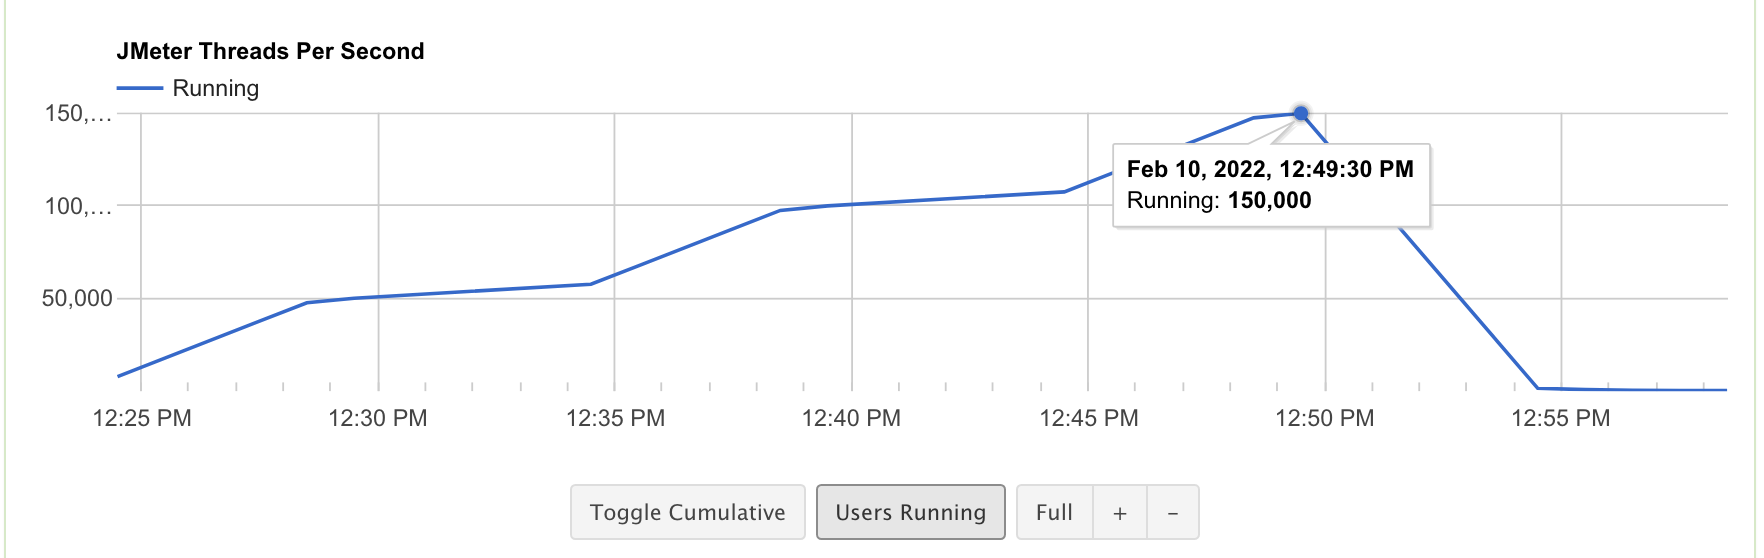
Recently, one of our client wanted to verify that his infrastructure could properly handle the delivery of a live sport event up to 150 000 watchers.
This streaming infrastructure was composed of
Velocix CDN
Origin delivering Live DASH and HLS
2 Datacenters
He wanted to check multiple things:
Customers user experience (no lags, accuracy of stream, no delay)
CDN and Origin delivery performance
Bandwidth of the network
Load balancing across 2 Datacenters
Performance Test his video streaming servers up to 150 000 players
His event was a national one, where customers would be watching an important football match in Europe.
So he contacted our professional services for a turnkey service of a realistic performance test on a HLS & DASH live streams in order to validate or improve his streaming infrastructure before the upcoming event.
Which tools to use and why ?
His OTT service was composed of an origin delivering Live Dash and HLS manifests using Velocix solution.
Since we needed to run a Performance Test for a on premise HLS Live stream, we used:
UbikLoadPack Video Streaming plugin fits customer requirements in the following fields:
Reproduce realistically and very easily a player reading Live stream delivered in HLS and MPEG-DASH in this particular case (MS Smooth is also supported). There is no need to write complex and unmaintainable test plan to reproduce the player behaviour, knowing that the multitude of formats and possibilities of Live Streaming makes this very complex and time consuming.
Provide custom metricsto analyze User watching video experience
Ability to graph those metrics
Availability from the Cloud. For the short term, customer wanted to run the test from the Cloud
Redline13 fits customer requirements in the following fields:
Easily deploy JMeter + UbikLoadPack with a single click from a web page on multiple servers in the AWS Cloud
Start those servers from all over the world using AWS datacenters from a simple Web Page, in this particular case, we used 5 European Datacenters and 150 Servers to spread the load
Live feedback on performance test
Merged results and metrics in one CSV accross all nodes
How to ensure the best quality of viewing experience during the live transmission of a theatre show ?
By performance testing video streaming services with UbikLoadPack
Recently, one of our client wanted to verify that their new streaming infrastructure could properly handle the delivery of a live theatre show up to 20 000 watchers.
Their solution had seen increased traffic and success following COVID19 pandemic and theatre being forced to close their doors.
This streaming infrastructure was composed of
A custom video streaming solution delivering Live HLS developed in Nods JS and built around MongoDB, Redis, Nginx, Docker, AWS ELB in the first phase
This application was hosted in AWS cloud initially and then moved to Scaleway Cloud
They wanted to check multiple things:
Customers user experience (no lags, accuracy of stream, no delay), they had previously faced a production incident leading to bad buzz
Size correctly the infrastructure
Check the performance after Cloud migration
Get deep analysis by our Professional Services who investigated the scalability problems, the application code to provide ways to handle more efficiently the expected load.
There main upcoming event was a national one, where customers would be watching a live theatre show from a very popular comic showman in France.
So they contacted our professional services for a turnkey streaming load test service.
Which tools we used and why ?
Since we needed to run a Performance Test for a Cloud hosted HLS Live stream, we used:
Reproduce realistically and very easily a player reading Live stream delivered in HLS. There is no need to write complex and unmaintainable test plan to reproduce the player behaviour, knowing that the multitude of formats and possibilities of Live Streaming makes this very complex and time consuming.
It provides custom metricsto analyze User watching video experience
It has the ability to graph those metrics
It is availability from the Cloud and On Premise. In this case the customer wanted to run the test from the Cloud
Redline13fits customer requirements in the following fields:
Easily deploy JMeter + UbikLoadPack with a single click from a web page on multiple servers in the AWS Cloud
Start those servers from all over the world using AWS datacenters from a simple Web Page, in this particular case, we used 5 European Datacenters and 150 Servers to spread the load
Live feedback on performance test
Merged results and metrics in one CSV accross all nodes
Let’s see how simple it is to setup a test using UbikLoadPack.
The outcome of our Professional Service:
Our professional services consultant worked with developer of the custom solution to:
Diagnose the stability and performance problems
Advise on fixing concurrency problems in the code, since our consultants are also senior developers with knowledge of different technologies (Java, PHP, NodeJS, .NET) and scalable architectures
Advise on improvements that could be applied to the software architecture
Help sizing and tune different components:
Nginx
System stack
SSL Layer
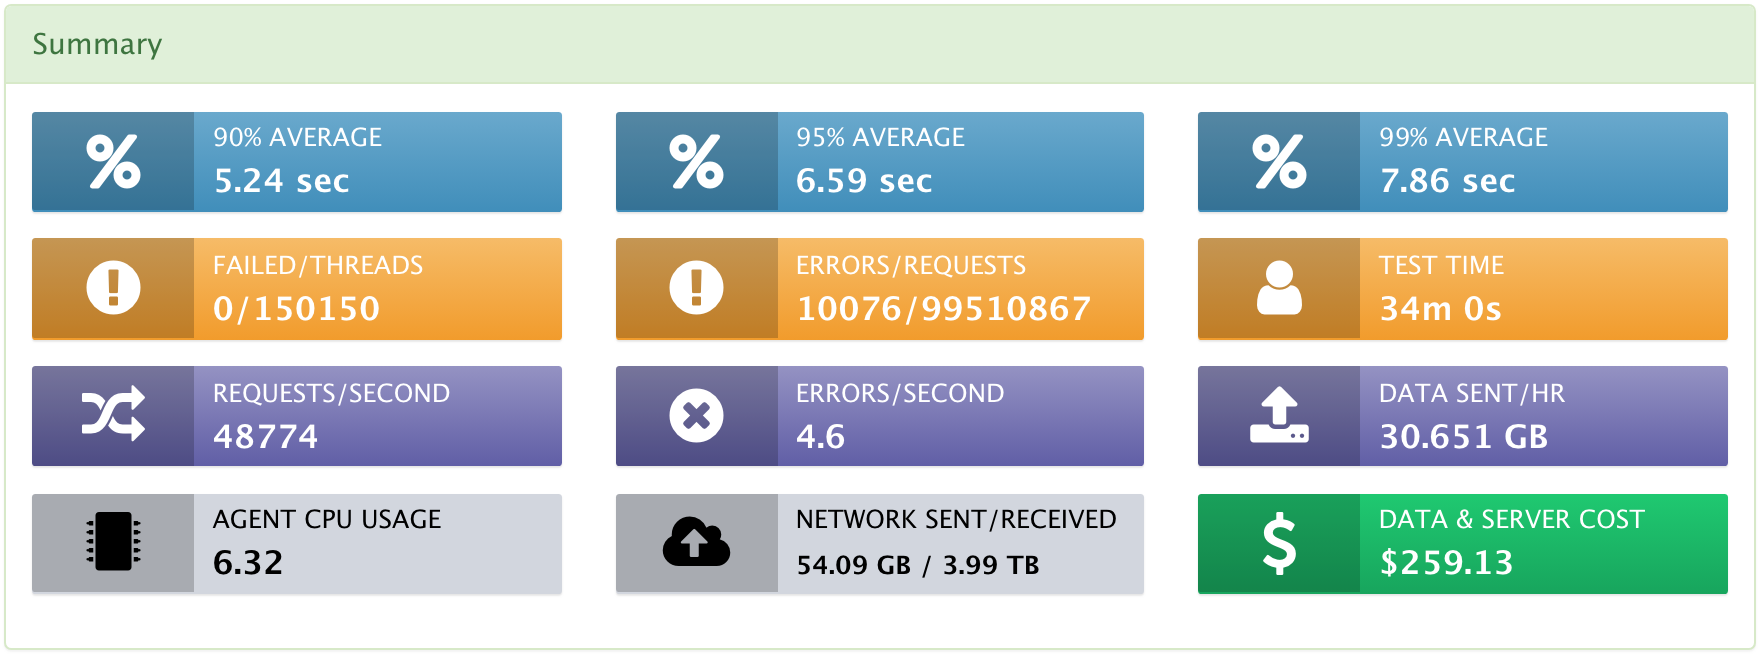
The metrics and results of this streaming load test:
Few numbers about this streaming performance test:
20 000 Virtual Users simulated reastically
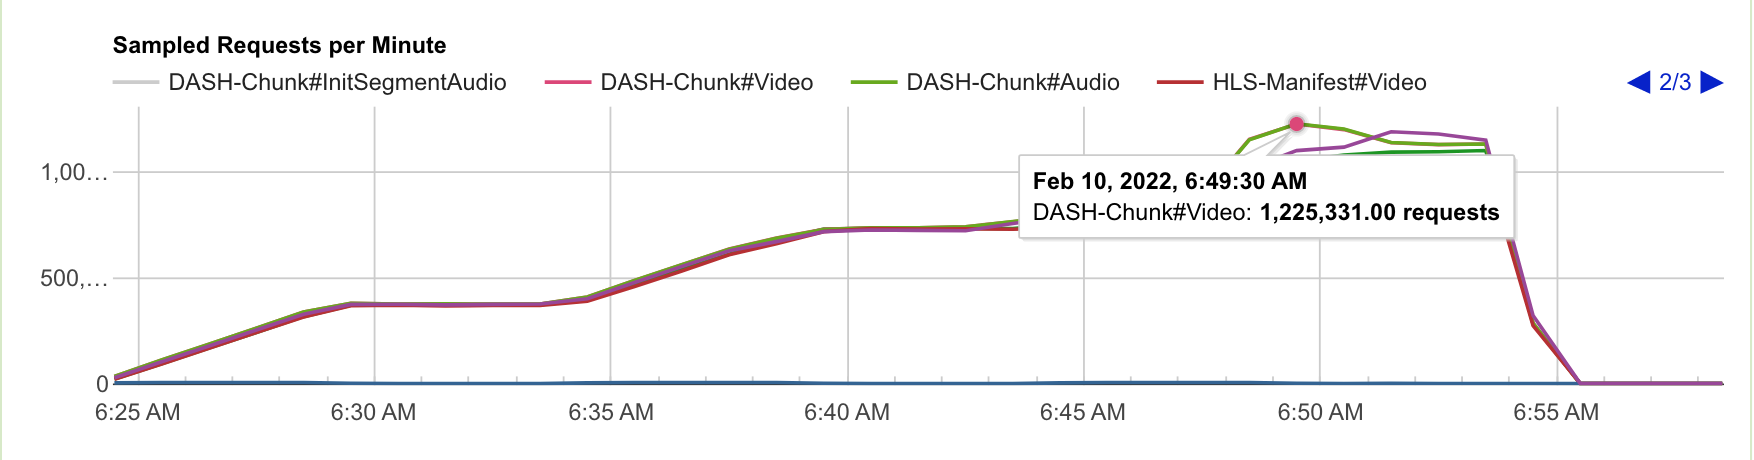
More than 175 000 requests per minute
Around 2 Tera Bytes received
Customer Platform scalability jumped from ability to hold 2 000 concurrent customers to 20 000
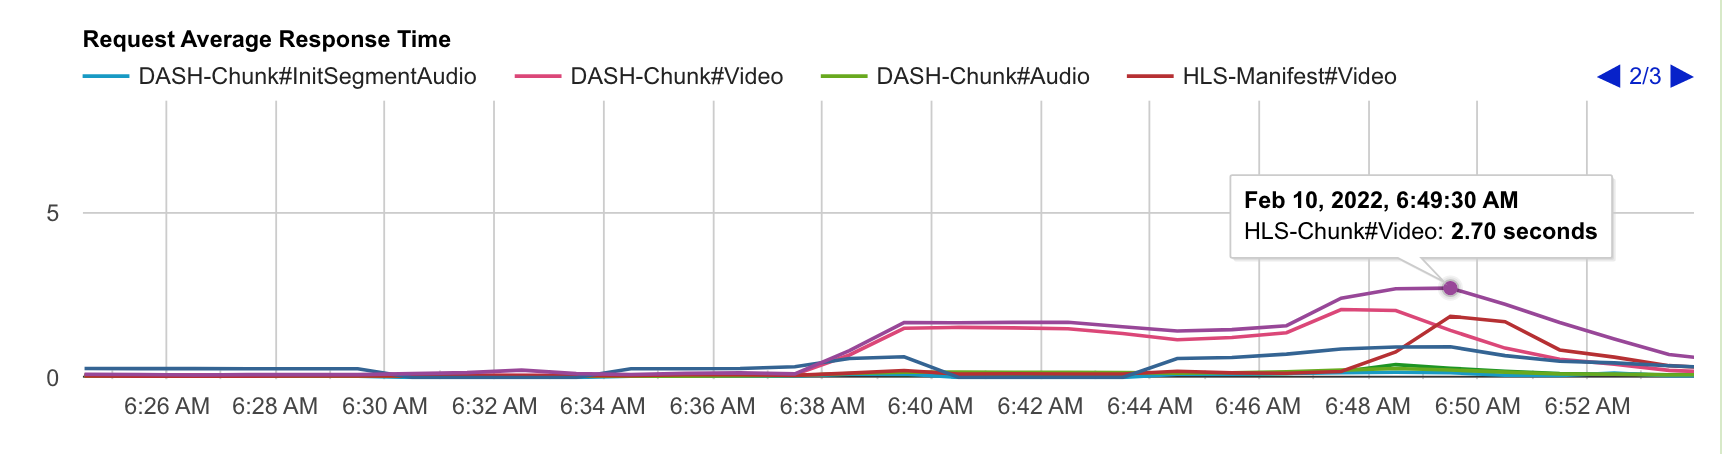
Average response time
Requests per minute
Summary report of load test metrics of a 20 000 Virtual Users shoot
Thanks to this load testing campaign, our customer was able to:
Run a streaming load test with 20 000 players on premise hosting
Diagnose multiple configuration problems
Diagnose and fix multiple application problems and optimize it
Provide his end-user customer metrics showing that their services was delivering streams as per requested SLR
In the broadcast industry, quality of service is important. Performance testing of streaming services helps to improve it and to choose the best options when new features are introduced.
Find out what led Ateme performance teams to choose the UBIK Load Pack streaming solution and the UBIK team to help them in the complex field of performance testing of streaming services including Low-latency HLS.
Success Story from the Broadcast Industry
Ateme enables thousands of the world’s leading content owners, broadcasters and service providers to captivate their audiences with a superior quality of experience through multi-codec encoding, any-format origin/packaging, scalable cloud DVR, audience-aware CDN and revenue-generating dynamic ad insertion solutions. Find out more: www.ateme.com.
Low-latency HLS challenge
Ateme continuously innovates to maintain a high Quality of Service.
By 2021, the quality team needed to test the performance of low-latency protocols (Dash & HLS) in Ateme’s new products to ensure that they would enable high-quality streaming services.
Ateme’s historical load-testing solution no longer met our needs as it did not perform well on long-lasting live windows. Furthermore, it did not support low latency and had no short-term plan to do so.
It was time to find a new solution and an accurate long-term partner.
Low-latency HLS performance testing solution
Ateme looked for a full-featured solution for streaming load testing that supported low-latency protocols, as well as a partner able and willing to cope with the fast evolution of the OTT market.
During its search, it assessed several solutions, such as Tsung, Httperf, Blazemeter, JMeter & UBIK Load Pack.
After a thorough study process and a POC, Ateme chose the UBIK Load Pack streaming solution and its experts specialized in streaming performance testing.
The solution had already proved its scalability (up to 200 000 VUs), was multiprotocol (Smooth, HLS, Dash) and supported on-premise and cloud installation.
The support of long-lasting live windows was efficient. Low Latency Dash was already supported. The TCO (Total Cost of Ownership) of the UbikLoadPack video-streaming plugin was low: there was no bundle to be bought with the solution. Access to the new version was included and the upgrade was easy. The maintenance cost was also low.
Thanks to this partnership, the UbikLoadPack team put Low-Latency HLS at the top of their roadmap.
All the performance campaigns performed in the Public Cloud were not possible with previous load-testing solutions. Now with UBIK Load Pack, the Ateme Benchmarks team is able to address these use-cases. Coupled with an Infrastructure as Code stack, we gain in flexibility for deploying/running and quickly destroying our load-testing environment.
Johan Lescot, Performance Team Manager , ATEME
Streaming performance testing partnership
The ability to scale up the ULP solution is definitely a driver for selecting and maintaining our choice to use this solution. Moreover it is not limited to a specific hardware and we can choose the best hardware device for running our campaigns.
Johan Lescot, Performance Team Manager, ATEME
After a few months of iterations between UBIK experts and Ateme innovation team, the UBIK Load Pack streaming solution featured support for Low Latency HLS in July’21. UBIK Load Pack load testing experts and the Ateme teams continue to share best practices and needs of the OTT sector through workshops.
UBIK brings the low-latency feature in a very efficient way. Also, working with UBIK engineering team helps us to bring new functionalities thanks to the great reactivity & availability of their team.
Johan Lescot, Performance Team Manager, ATEME
Contexts of use of UBIK Load Pack streaming performance testing solution
2 Ateme teams use the UBIK Load Pack streaming solution to test streaming services reaching up to 25 000 virtual users and built on Smooth, Dash and HLS protocols.
The first team uses it on a daily basis to continuously benchmark their “on-the-market OTT products.” The UBIK Load Pack streaming solution helps the team to identify performance regressions on each commit and allows them to fix those problems quickly.
The second team uses UBIK Load Pack streaming solution to check the quality and test the best options for the performance of new products and innovative features.
Thanks to the ULP solution, we’ve been able to increase our result analysis into the response time percentiles area by filtering on the various chunk types and manifest.
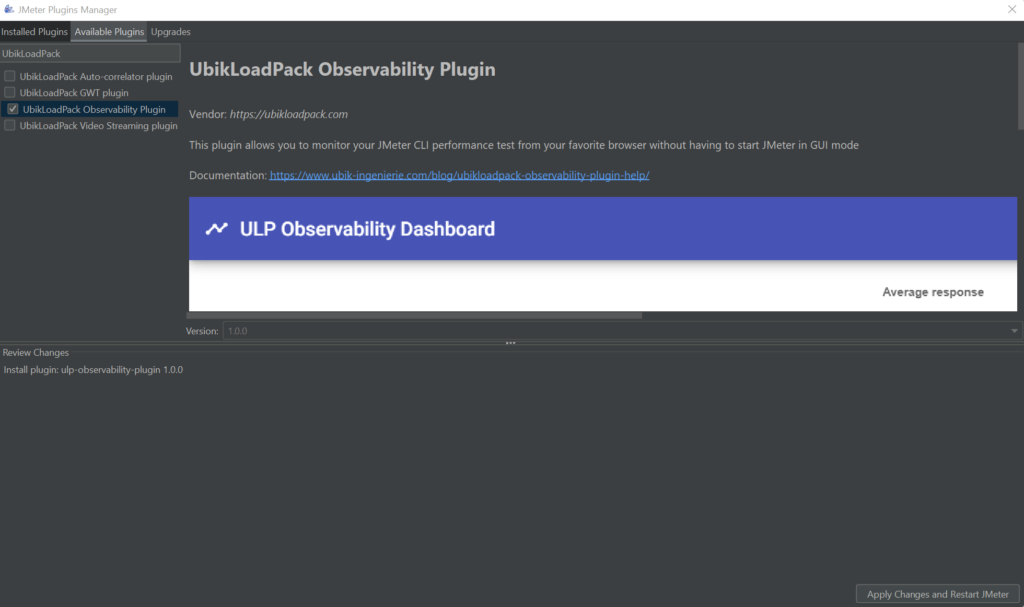
UBIK LOAD PACK OBSERVABILITY PLUGIN allows you to monitor your JMeter CLI performance test from your favorite browser without having to start JMeter in GUI mode.
This listener gives you data and KPIs regarding the outcome of your load testing in a visual way. This allows you to analyze more efficitently your performance test and make it simpler for you to choose the next steps for your website or app.
ULP Observability listener
Observability Listener JMeter Control Panel
Installation
Via PluginsManager
If you have not installed jmeter-plugins yet: get the jar from here
put it in jmeter/lib/ext directory
if you’re behind an enterprise proxy with (for example) the following configuration:proxyHost : my.proxy.server
proxyPort : 8000
proxyUser : user
proxyPassword : pass
use the following command to launch Apache JMeter :
Windows : set JVM_ARGS="-Dhttps.proxyHost=my.proxy.server -Dhttps.proxyPort=8000 -Dhttp.proxyUser=user -Dhttp.proxyPass=pass" && %JMETER_HOME%\jmeter.bat
If you experiencing “Connection Timed Out” errors, you can set this property in the user.properties file: jpgc.repo.timeout=120000
Restart JMeter
In JMeter, open the plugin manager (icon on the far right)
In the “Available Plugins” tab and in the search field enter the term “UbikLoadPack”
Select the UbikLoadPack Observability Plugin
Click the “Apply Changes and Restart JMeter” button
UbikLoadPack Observability plugin in JMeter Plugin Manager
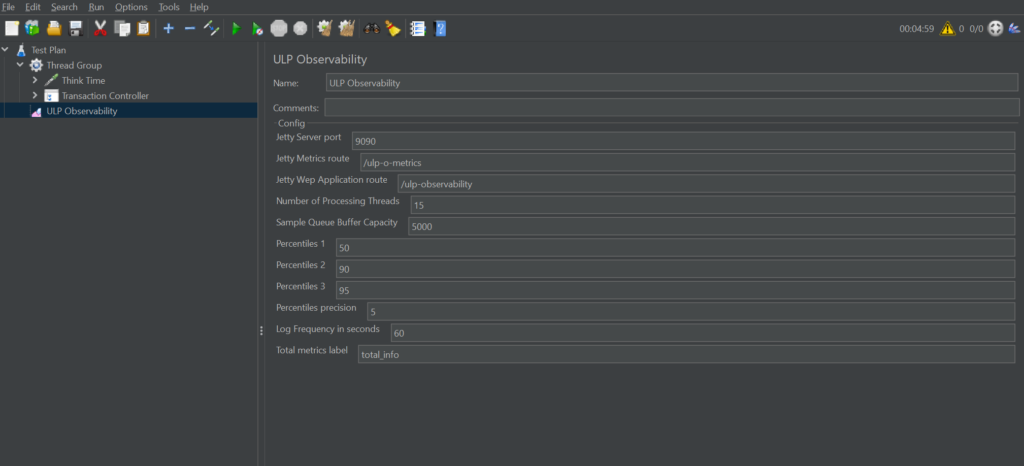
Plugin parameters :
Jetty Server port : The port on which the plugin will expose the metrics, defaults to 9090
Jetty Metrics route : Path to the metrics endpoint, by default : http://localhost:9090/ulp-o-metrics
Jetty Web Application route : Path to the web application exposing the GUI, by default : http://localhost:9090/ulp-observability
Number of Processing Threads : Number of threads processing the request results
Sample Queue Buffer Capacity : Size of the queue containing the SamplerResults, this queue must be sized depending on your performance test throughput to avoid contention during the test
Percentiles : 3 percentiles you can adjust to your needs to better evaluate your requests response time.
Percentile precision : This setting allows you to adjust your percentiles precision up to 10^x.
Log Frequency in seconds : Time between each test result refresh, after starting the test you need to wait for at least two actualization for the chart to be plotted. This also controls logs refresh.
Total metrics label : A label you can define to name the results summary of your test.
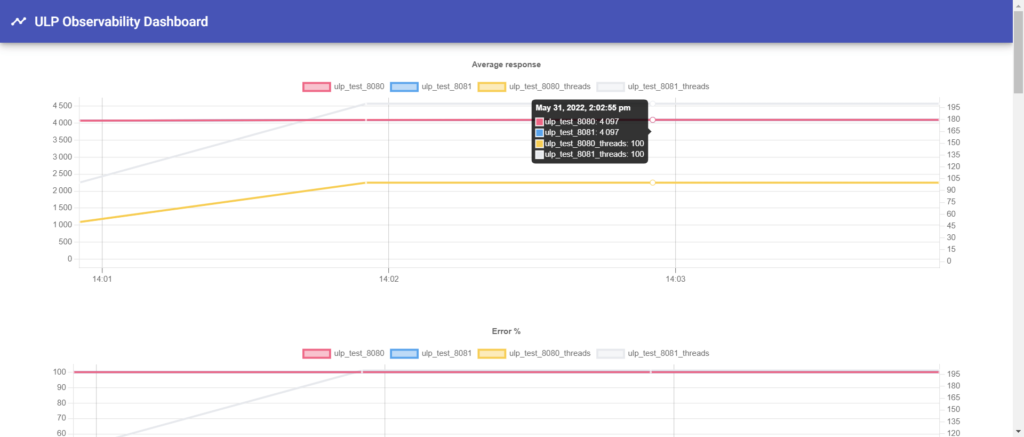
Plugin results :
Example of a metric chart
Left y-axis: metric of each group of samples
Right y-axis: cumulative number of threads in each group of samples
Graphs implemented for : average response, maximum response, percentiles, error percentage and throughput
JMeter offers users a straightforward and user-friendly GUI. The user can use elements like Thread Groups, Samplers, Processors, Controllers, Timers, etc. to build their performance test script.
JMeter GUI mode additionally provides the ability to view and examine the script’s outcome utilizing various Listeners. In addition to the mentioned features, JMeter GUI mode has the following drawbacks:
Running JMeter in GUI, Java will favor the AWT Event Dispatcher Thread used to render GUI vs Threads running JMeter test
Monitoring a JMeter performance test in GUI mode requires adding
When a test plan includes complicated test scenarios with several test steps and operations, JMeter GUI mode consume a lot of CPU and memory, which has an impact on the test results.
The system will also slow down if more Listeners are added to the Test plan.
To avoid above issues and get the optimal results, you must run your JMeter scripts in Non GUI mode at the expense of analysis efficiency.
Introducing UbikLoadPack Observability Plugin
Observability Listener JMeter Control Panel
Fortunately, UbikLoadPack Observability plugin allows you to to monitor your JMeter CLI performance test from your favorite browser without having to start JMeter in GUI mode.
This listener provides you with information and KPIs about your load testing results from a browser, making it simpler for you to decide on next steps for your website or app and allowing you to analyze the success of your performance tests.
How-to
1) If you have not installed jmeter-plugins yet : get the jar from here, and put it in jmeter/lib/ext directory
2) Once done, search for “UbikLoadPack Observability plugin” in the plugin manager and download it
UbikLoadPack Observability plugin in JMeter Plugin Manager
3) After restarting JMeter add the plugin as a listener of Test plan.
4) Tweak the plugin parameters to your needs or leave the default settings.
You can now start your test plan from GUI mode, non GUI mode, on local or distributed testing and access the result of your performance test in live time from your browser.
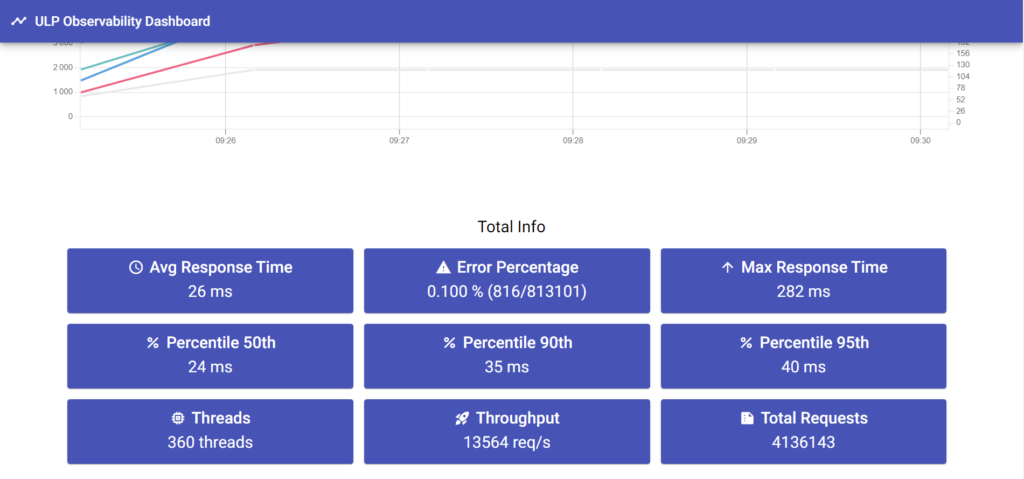
Plugin results
This plugin let you analyse your performance test results by plotting the following metrics in easy to read graphs:
Average response
Maximum response
Percentiles
Error percentage
Throughput
Example of a metric chart
Left y-axis: metric of each group of samples
Right y-axis: cumulative number of threads in each group of samples
In JMeter, a property is a key-value pair that is used to store configuration settings and other data. This data can then be referenced by other elements in your test plan (CSV DataSet for example).
Properties are defined at the test plan level and can be accessed by any element within the test plan. Properties can be used to configure various elements in your test plan, such as the number of threads, the ramp-up time, and the duration of the test.
Defining a property
Properties can be defined in several ways in JMeter:
1) User Defined Variables:
Properties can be defined as user-defined variables in the “User Defined Variables” element. This is a simple way to define and manage properties within your test plan.
2) Command-line options:
Properties can be set using command-line options when starting JMeter. For example, you can set the number of threads using the -J option, like this:
jmeter -JnumThreads=10
3) Properties file:
Properties can be defined in a properties file, we usually use user.properties (which is provided by default by JMeter for such purpose). This file can then be loaded into JMeter using the -q option. For example, if you add to your user.properties file the below code:
numThreads=10
rampUpTime=5
Then, you can load this file into JMeter using the following command:
jmeter -p jmeter.properties -q user.properties
Using a property
Once a property is defined, it can be referenced by other elements in your test plan using the ${__P} function.
For example, if you define a property named “numThreads”, you can reference it in a Thread Group element like this:
${__P(numThreads)}
Note you can add a default value like this, we define below that numThreads will be equal to 10 if property is not explicitly defined by user:
${__P(numThreads, 10)}
About UbikLoadPack:
Ubik Load Pack is a set of Enterprise Grade plugins for Apache JMeter.
We’re strong contributors to JMeter and its eco-system